What is Time to First Byte (TTFB)?
Time to First Byte (TTFB) is the time between a browser starting to load a page and the first byte of the response arriving. Google’s definition is the time between starting navigating to a page and when the first byte of a response begins to arrive. It is measured in milliseconds and reported for the page’s main document.
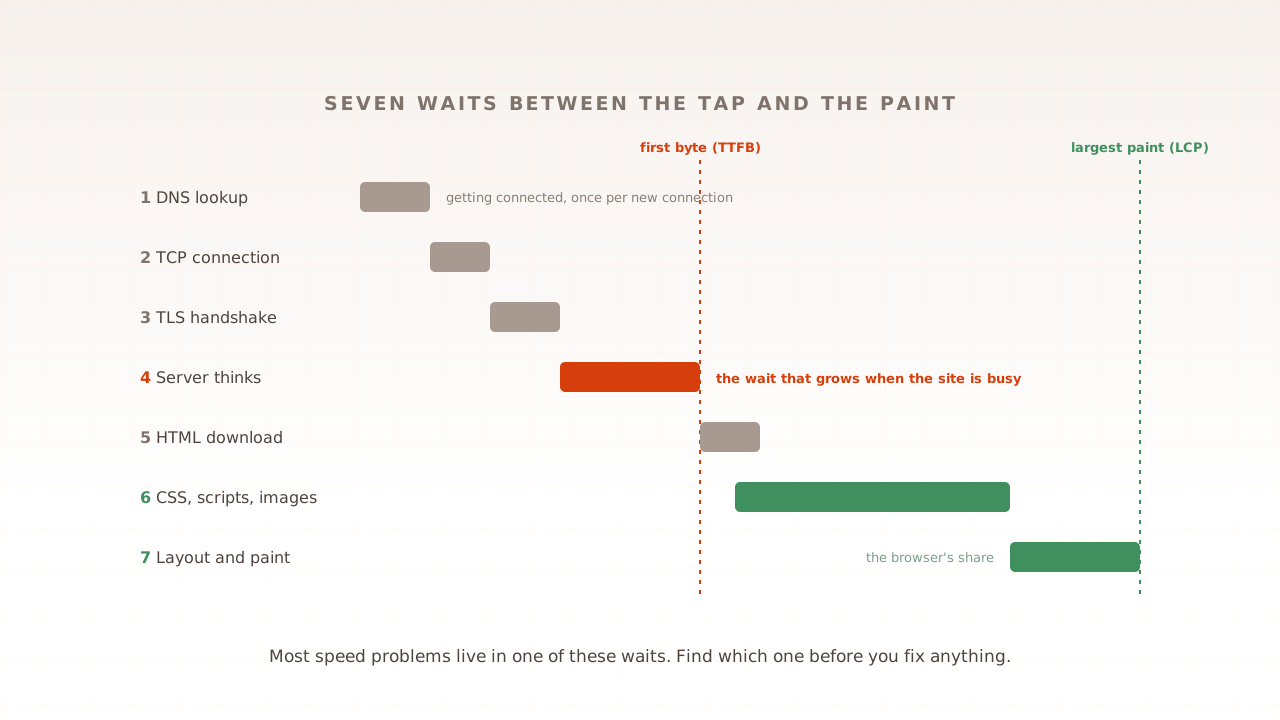
TTFB is not just server time. Google lists the phases it adds together: redirect time, service worker startup if the site uses one, the DNS lookup, connection and TLS negotiation, and the request itself, up to the moment the first byte arrives. Part 8 of this guide walked through those waits in order.
A restaurant is a fair picture. TTFB is the time from walking through the door to the first plate landing on your table. It includes being shown to a seat and placing the order, not just the time the kitchen spends cooking. A slow first plate might mean a slow kitchen, or a long walk to the table, or both.
That mix is the most important thing to understand about the metric. TTFB combines network travel, which depends on the visitor, with server work, which depends on you. Reading it well means separating the two.
What is a good TTFB?
Google’s guidance is that a good TTFB is 0.8 seconds or less, and a poor one is greater than 1.8 seconds, measured at the 75th percentile of page loads. Anything in between needs improvement. These are deliberately loose: Google calls them a rough guide, to be weighed against how your site delivers its main content.
| TTFB at the 75th percentile | Rating |
|---|---|
| 0.8 seconds (800 ms) or less | Good |
| 0.8 to 1.8 seconds | Needs improvement |
| More than 1.8 seconds (1,800 ms) | Poor |
The thresholds are loose because TTFB is not a Core Web Vital. Google says that because TTFB isn’t a Core Web Vitals metric, it is not absolutely necessary that sites meet the good threshold, provided that it doesn’t stop them scoring well on the metrics that matter. A page rendered on the server can have a higher TTFB and still show content sooner than a page assembled in the browser.
You will see other numbers quoted. Chrome’s Lighthouse audit recommends 600 ms, and Chrome explains the difference: the TTFB guidance (800 ms) is longer than the server response time it recommends (600 ms) because TTFB also includes the DNS lookup and redirects. Many hosting articles still quote 200 ms, which echoes older PageSpeed advice on server response time rather than Google’s current TTFB thresholds.
How common is good? The HTTP Archive’s 2025 Web Almanac found that 44% of mobile websites have good TTFB, 40% need improvement and 17% perform poorly. On desktop, 55% are good.
Why does TTFB matter if it is not a Core Web Vital?
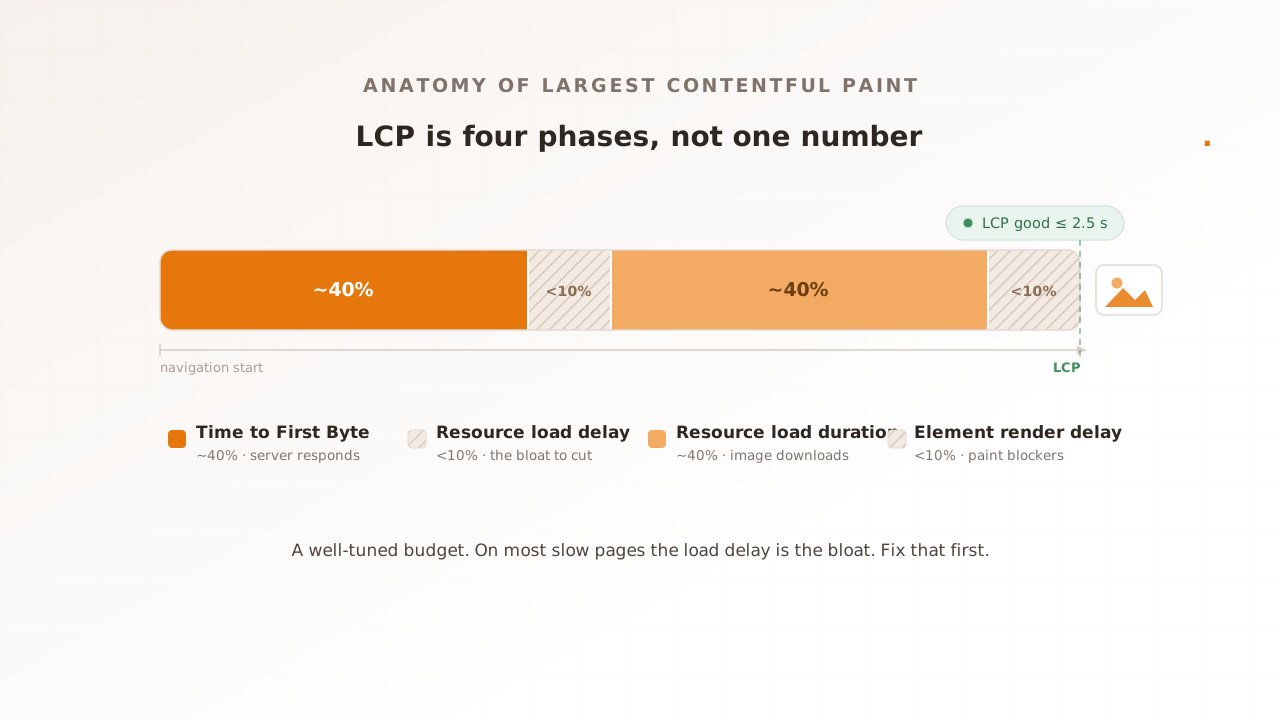
Because it comes first. Nothing on the page can appear before the first byte arrives, so TTFB is the opening slice of every loading metric, including Largest Contentful Paint (LCP), the Core Web Vital that measures when the main content shows. A slow TTFB leaves less of the 2.5-second LCP budget for everything else.
Google’s Chrome team measured how much. In an analysis of real-user data, it found that among origins with good LCP, the median 75th-percentile TTFB was 600 ms, while for at least half of the origins with poor LCP, the p75 TTFB of 2,270 milliseconds alone nearly guarantees that LCP can’t be faster than the 2.5-second good threshold. A server that slow uses most of the budget before the browser has anything to work with.
The reverse is not true. A good TTFB does not promise a good LCP, because the page can still lose time discovering, downloading and rendering its main image or text. Our guide to Largest Contentful Paint covers the rest of that journey. But a poor TTFB is close to a guarantee of a poor LCP.
There is also a search consequence that is easy to miss. Google’s documentation on crawling large sites says the crawl capacity limit goes up if the site responds consistently and its response times, including latency and time to first byte, remain stable or improve. A slow, inconsistent server gets crawled less.
What makes up TTFB?
TTFB is a sum of phases, and each has a different owner. The first few depend mostly on the visitor’s network and the distance to your server; the last depends mostly on your server. When TTFB is high, the useful question is which phase grew.
| Phase | What happens | Mostly depends on |
|---|---|---|
| Redirects | The browser follows any redirects before the real page | Your links and site setup |
| Service worker startup | A service worker, if the site has one, starts up | Your code |
| DNS lookup | The browser finds the server’s address | The visitor’s resolver and cache |
| Connection and TLS | A secure connection is opened | Round-trip time to the server |
| Request and server time | The request travels, the server builds the reply, the first byte returns | Your server, plus one round trip |
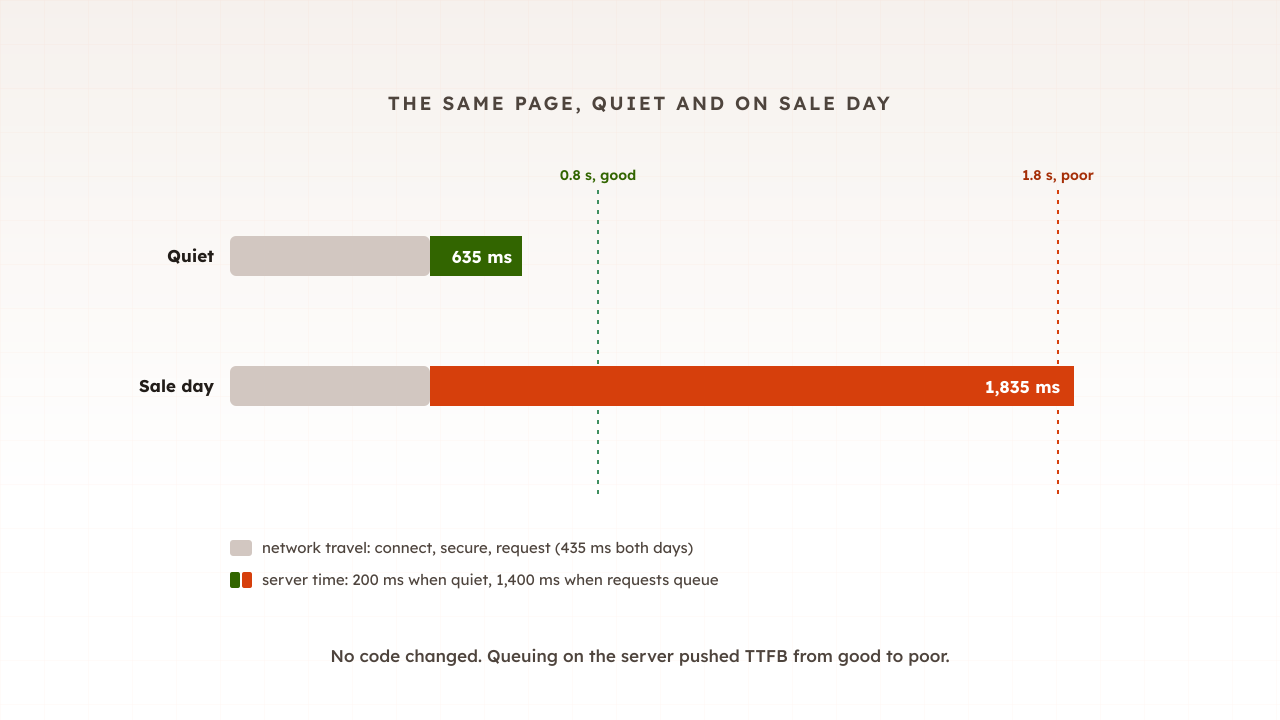
Here is a worked example for a new visitor on a phone, using the 145 ms mobile round trip from part 8. The address is already cached. Opening the connection takes one round trip, securing it takes another, and the request and its reply a third: 435 ms of travel. If the server takes 200 ms to build the page, the first byte arrives after about 635 ms. That is good.
Add one redirect that sends the visitor to a different host, such as from the bare domain to the www address, and the browser pays for another connection and request, several more round trips. The same page can drift past 0.8 seconds before the server has done anything slower.
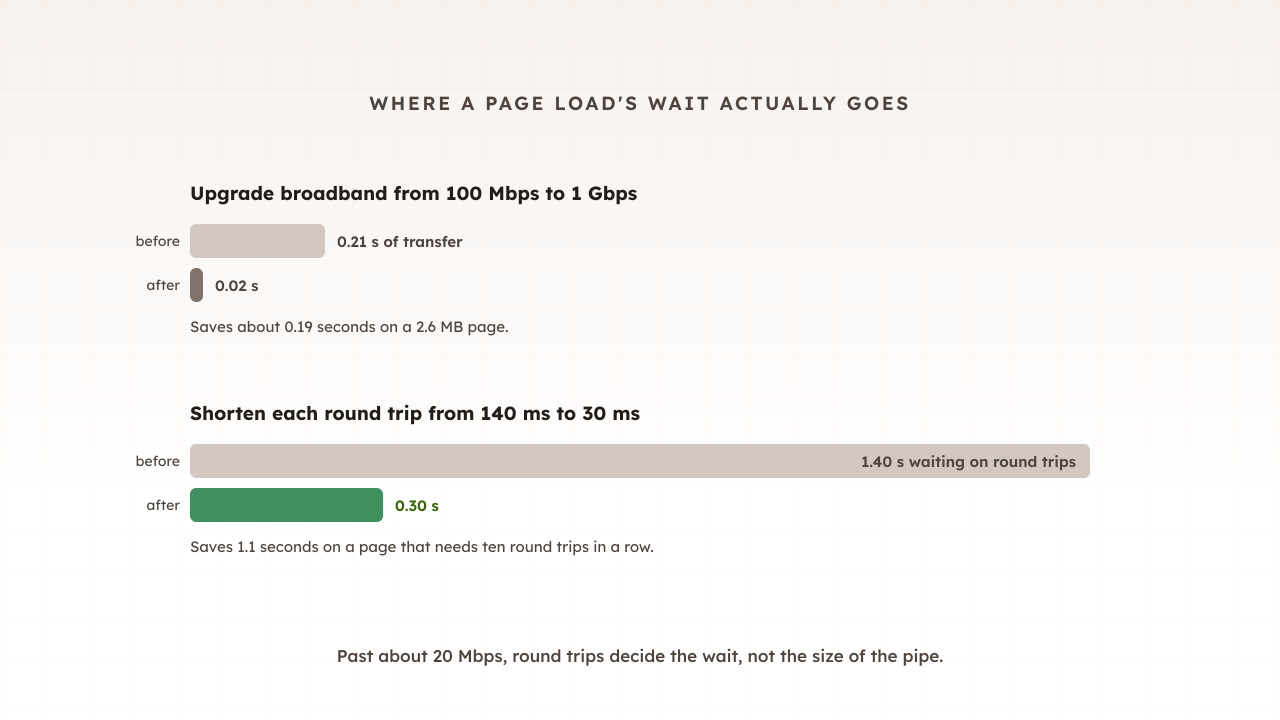
The network side of this is the subject of part 10, on latency and round trips. The server side is where the rest of this article goes.
How do you measure TTFB?
Measure it in two places: in a lab, where you control the conditions and can see the phases, and in the field, where real visitors tell you what they actually got. Each catches problems the other misses, so check both before deciding where the time goes.
In the browser. Open Chrome DevTools, go to the Network panel, reload, and select the first request, which is the page itself. The Timing tab breaks the request into phases. Chrome’s documentation describes the waiting phase as one where the browser is waiting for the first byte of a response, and this timing includes one round trip of latency and the time the server took to prepare the response. Note that this phase alone is shorter than full TTFB, which also includes the connection setup listed above it.
From the command line. curl can print the same number. Its time_starttransfer value is the time from the start until the first byte was received, including the time the server needed to calculate the result. Run curl -o /dev/null -s -w '%{time_starttransfer}\n' https://example.com/ against your own page, several times.
From real visitors. PageSpeed Insights shows field TTFB from the Chrome User Experience Report for sites with enough traffic, at the 75th percentile. Evaluat’s free website speed test loads a public URL once in a real browser and reports TTFB alongside LCP, CLS and FCP, which is a quick lab reading.
From the server. A Server-Timing response header lets your server report how long its own work took, as in Google’s example Server-Timing: db;desc="Database";dur=121.3, ssr;desc="Server-side Rendering";dur=212.2. Browsers show it in DevTools, which turns “the server is slow” into “this query is slow”.
Can a CDN hide a slow TTFB?
Yes, on the pages it caches. A content delivery network answers cached pages from a server near the visitor without asking your origin at all, so TTFB looks excellent however slow your server is. Pages that cannot be cached, such as the basket and checkout, still wait on your origin.
Google warns about this directly: caching can mask a slow backend, making long TTFBs harder to diagnose, since testing a cached page often shows no TTFB issues. It recommends building a way to skip the CDN, such as a URL parameter, so you can measure the origin.
The pages that make money are usually the ones a CDN cannot help with:
- HTML is often not cached at all. Cloudflare, for example, does not cache HTML or JSON by default, and skips caching when a response sets a cookie.
- Checkout and basket pages are uncacheable by design. Adobe Commerce documents that by default all pages are cacheable except the checkout pages, and names compare, cart and checkout pages as ones that should not be cached.
- Tracking parameters can break caching on pages that should be cached. RUMvision found product pages reached through a Google Merchant Center parameter missed the cache, comparing a 1,417 ms TTFB with the 302 ms that a proper caching strategy could have achieved.
So test the homepage and you may be testing your CDN. Test the basket with an item in it and you are testing your server.
Why does TTFB rise when a site is busy?
Because requests start to queue. A server can only work on so many requests at once; when more arrive, the extras wait for a free worker, and that waiting time lands inside time to first byte. Network phases barely change with your traffic, so the server part of TTFB is where load shows first.
Google’s Site Reliability Engineering book gives the arithmetic. If a request takes 100 milliseconds of work and the queue in front of each worker can hold ten requests, then when the queue is full a request takes 1.1 seconds to handle, most of it spent in the queue. The work did not get slower. The wait got longer.
Queues also grow faster than intuition suggests. Marc Brooker, an engineer at Amazon Web Services, shows with a simple queueing model that at about half utilisation there is on average one request in the system, and at 99% there are 99. He describes high-percentile latency as a good leading indicator of pending overload.
Put that next to the worked example above. On a quiet afternoon the server takes 200 ms and the visitor’s TTFB is about 635 ms, which is good. On sale day the same server, now queuing, takes 1.4 seconds, and TTFB becomes about 1.84 seconds, past the 1.8-second line into poor. No code changed. That is why TTFB should be measured on uncached pages while the site is under realistic load, not only when it is idle.
How do you improve TTFB?
Work from the phase that grew. Network phases improve with fewer redirects and shorter distances; server time improves with caching and with finding the slow work. Most sites get the biggest gains from caching more pages and from fixing a handful of slow queries on the pages that cannot be cached.
- Cache what is the same for everyone. Category and product pages can often be served from a full-page cache or a CDN. Make sure tracking parameters are ignored in the cache key so they do not split the cache.
- Remove redirects. Link to final addresses, especially in ads and emails, and avoid chains.
- Serve from close to your visitors. A CDN shortens the connection phases even for pages it cannot cache.
- Find the slow work. Add
Server-Timingand profile the uncached pages: basket, checkout, search and account. Slow database queries and calls to other services are the usual culprits. - Plan capacity for the peak. If TTFB is fine when quiet and poor under load, the fix is capacity or efficiency on the server, and only a test at realistic load shows how much is needed.
One caution when you see TTFB fall suddenly. Responses that send 103 Early Hints can make TTFB look faster, and Google notes that like caching, they can mask the real TTFB of a site. Check the server time separately before celebrating.
Common mistakes with TTFB
Most TTFB mistakes come from measuring the wrong page or the wrong moment.
- Testing only the homepage. It is usually the most cached page on the site. Test the basket and checkout too.
- Reading TTFB as server time. It includes redirects, DNS and connection setup. Split it before blaming the back end.
- Chasing an old threshold. Use Google’s 0.8 and 1.8 seconds as the guide; 200 ms targets are older advice, not the current guidance.
- Trusting a lab number over field data. Real visitors arrive through redirects, on slower networks and logged in.
- Measuring only a quiet site. TTFB is the metric most likely to change when traffic arrives.
How Evaluat measures TTFB under load
Evaluat runs each virtual user in an isolated real browser, so it records TTFB the way a customer’s browser does, split into its Navigation Timing phases: DNS lookup, connection, TLS negotiation and time to first byte, per URL and at any percentile from p50 to p99. Web Vitals captured at load. Per session. Per URL.
That lets you see the pattern this article describes. As virtual users ramp up, connection times stay flat on every page, cached product pages stay fast, and TTFB on the basket and checkout pages climbs. You can then open a session from the slow period and see, in its network log, how long the page waited for its first byte, and what it did next.
The boundary is worth stating. Evaluat shows what its browsers saw under the test conditions you chose, from the region closest to your customers. It does not replace field data from your real visitors or the server-side profiling that explains why a query is slow. It tells you which pages slow down, at what load, and by how much.
TTFB, then, is the first number in every page load and the first to move when your server is under pressure. Know which of your pages are cached, measure the ones that are not, and measure them again with traffic running.
Test in real browsers. Debug in real sessions. Book a demo to see your own uncached pages measured under load.