What's in a report

A verdict up front. Evidence one click away.

This page is a walkthrough of what an Evaluat test report contains. It is not a gallery of public customer runs. Every test produces a shareable report with five forensic views for your engineers, and you can generate an Executive Summary on top.

The verdict

Start with the Executive Summary.

A plain-language verdict with a health score, the key findings ranked by severity, and recommended fixes, grounded in the run data. It turns a dense report into a two-minute read you can share with stakeholders. Generated on demand.
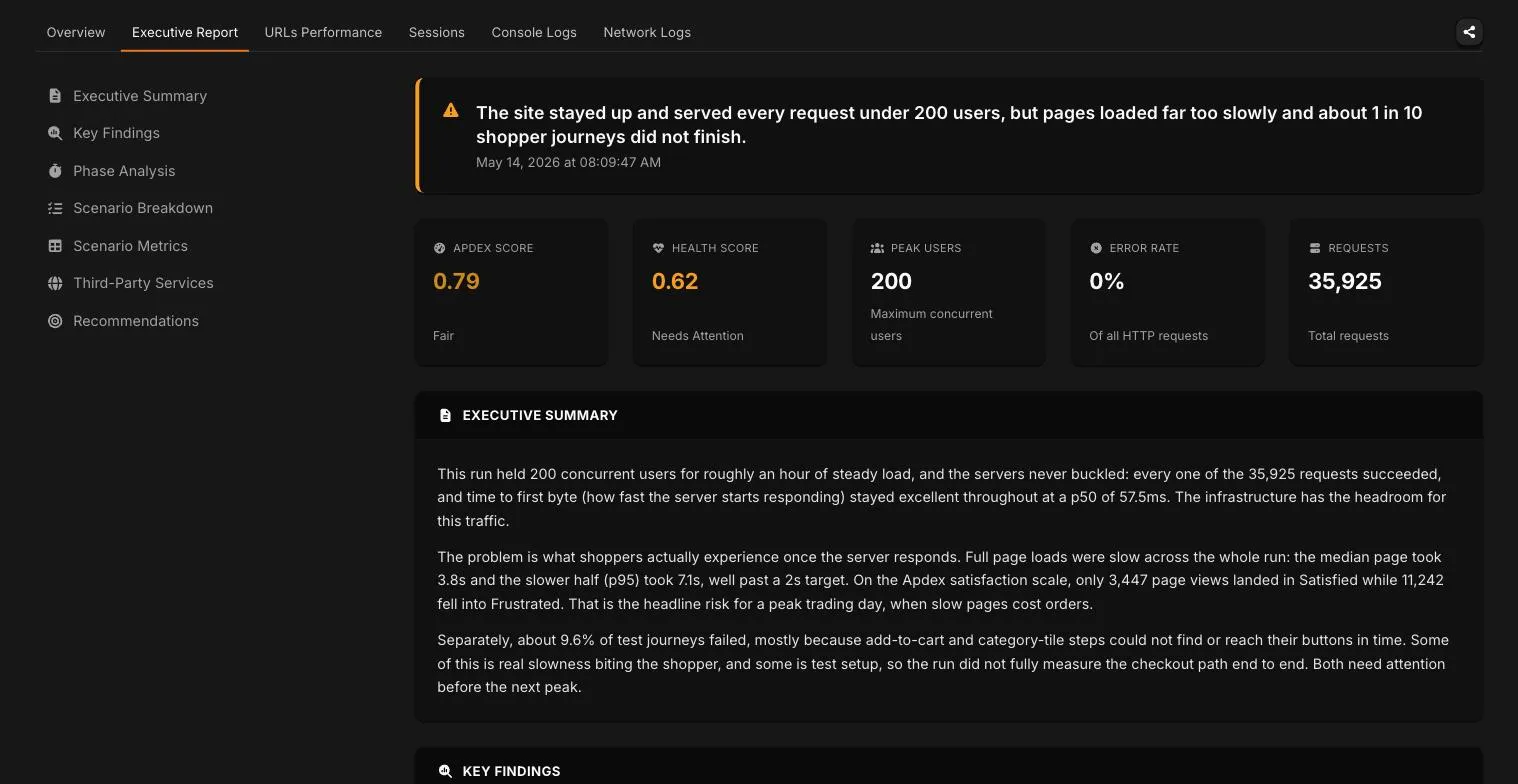
Evaluat Executive Report: a plain-language verdict, a health score of 0.62, and the Executive Summary in full, from a 200-user peak-trading rehearsal.
A real Evaluat report from a 200-user run, shown to demonstrate the format. Company name, journey labels, and URLs anonymised at the customer's request. Your report is generated from your own run, and Executive Summary is not available on the Starter plan.
In every report

Five views, from one real-browser run.

Report views. Pick one to see that view of the run.
Evaluat report Overview: test execution details, an Apdex of 0.79, 200 peak users, a 0% error rate, and the user ramp curve across the run, from a 200-user peak-trading rehearsal.
Evaluat URLs Performance view: per-URL hit counts, status codes, and Core Web Vitals including LCP, CLS, and INP, from a 200-user peak-trading rehearsal.
Every URL in the journey broken out, so you can see exactly which step slowed down under load.
Evaluat Sessions view: every virtual user's session listed with start time, duration, scenario, and pass or fail status, from a 200-user peak-trading rehearsal.
A recorded session for every virtual user, so you can watch the exact run that failed instead of inferring it from an average.
Evaluat Console Logs view: browser console warnings and messages deduplicated with a count for each across the whole run, from a 200-user peak-trading rehearsal.
The browser console output captured per session, errors and warnings included.
Evaluat Network Logs view: every HTTP request with its page URL, hit count, status, and p95 duration, from a 200-user peak-trading rehearsal.
The network activity captured per session, so you can see what was slow or failing on the wire.

A real Evaluat report from a 200-user run. Company name, journey labels, and URLs anonymised at the customer's request.

The five views are the engineering half. How each is captured is on How it works.

Get a report for your site

Test in real browsers.
Debug in real sessions.

Want a report with your data in it?

Run a free Pulse speed test for an instant real-browser report on one page, or book a demo and watch a small test run live on your real customer journey.