What is the difference between latency and bandwidth?
Bandwidth is how much data a connection can carry each second. Latency is how long it takes for data to make one journey across it. Bandwidth is measured in megabits per second (Mbps) and latency in milliseconds (ms). A connection can have plenty of the first and still feel slow because of the second.
A motorway is the easiest picture. Bandwidth is the number of lanes. Latency is the length of the road. Adding lanes lets more cars travel at once, but it does not shorten the drive. If your errand needs ten separate trips there and back, the length of the road decides how long your afternoon takes.
That is the situation of a web page. A browser does not fetch a page in one long download. It makes a series of short exchanges, and many of them must wait for a reply before the next can begin. Each exchange is a round trip, and the round trips add up.
| Bandwidth | Latency | |
|---|---|---|
| What it measures | How much data per second | How long one trip takes |
| Unit | Megabits per second (Mbps) | Milliseconds (ms) |
| What sets it | The visitor’s broadband or mobile plan | Mostly distance, plus the networks in between |
| Helped by | A faster plan | A closer server, fewer trips |
| Limits web pages when | The connection is slow or the page is heavy | Almost always on today’s connections |
What is latency?
Latency is the time data takes to travel from one point to another. MDN, the reference documentation for web developers, defines it as the network time it takes for a requested resource to reach its destination. Low latency means little delay. It is measured in milliseconds, and for web traffic it is usually quoted as a round trip.
A one-way figure is rarely useful on its own, because nothing on the web happens in one direction. The browser asks and the server answers. So the practical unit is the round trip time (RTT), which MDN describes as the time it takes for a data packet to be sent to a destination plus the time it takes for an acknowledgment to be received back. When you run a speed test and it shows your ping, that is a round trip time.
Several things add up to latency. The signal has to cover the physical distance. Each router along the way spends a little time forwarding it. If any link is busy, the data waits in a queue. Distance is the part nobody can engineer away, which is why where your server sits matters more than most people expect.
The word has a second meaning that causes confusion. Engineers also use latency for how long a server takes to answer a request, which has nothing to do with the network. That kind of latency is covered further down, because it behaves very differently when a site is busy.
What is bandwidth, and how is it different from throughput?
Bandwidth is the maximum amount of data a connection can carry each second. Throughput is the amount it actually carries in practice. The gap between them comes from congestion, protocol overhead and, for web pages, all the time spent waiting on round trips instead of transferring data.
Bandwidth is what broadband adverts sell, and in the UK it has grown fast. Ofcom’s Connected Nations report for 2025 found that the average UK maximum download speed rose by almost 30% in a year, from 223 Mbit/s in 2024 to 285 Mbit/s in 2025. That is a provider-reported maximum rather than a measured average, but the direction is clear.
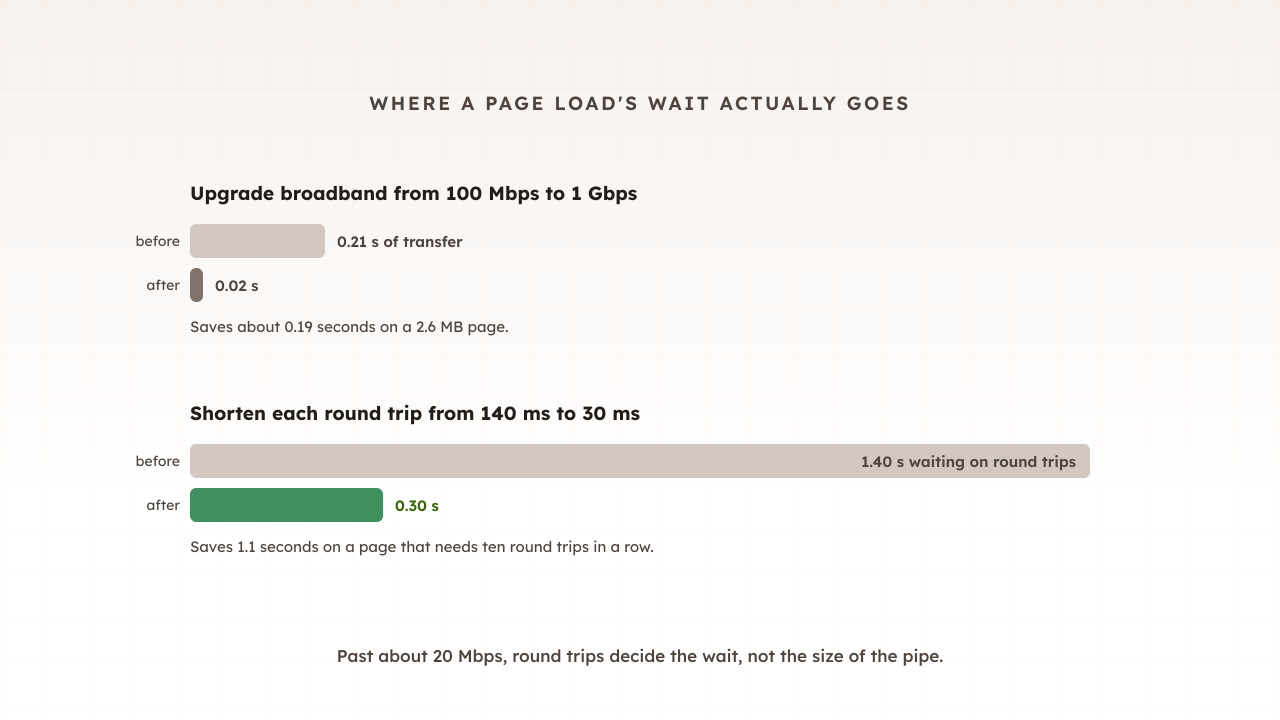
Pages have grown too, though much more slowly. The HTTP Archive’s 2025 Web Almanac puts the median mobile page at 2.6 MB. The arithmetic is simple. 2.6 megabytes is about 21 megabits, so at 100 Mbps the raw transfer takes about a fifth of a second. At 20 Mbps it takes about one second.
Bandwidth still matters at the low end. On a weak mobile signal or a congested connection, a heavy page is slow for exactly the reason the adverts suggest. But for most visitors on most connections, the transfer itself is the short part of the wait.
What is a round trip, and why do web pages need so many?
A round trip is one message going out and its reply coming back. Web pages need many of them because each step of loading a page depends on an answer from the step before, and because a single page pulls files from several different servers.
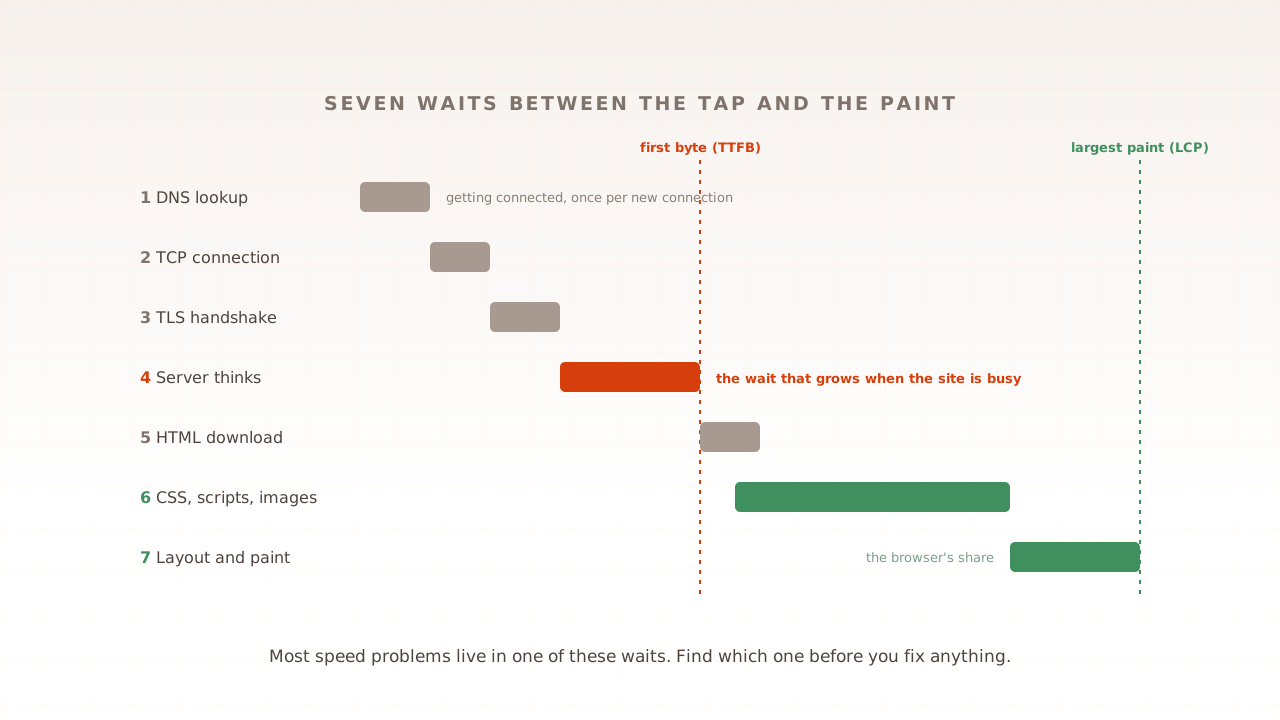
Part 8 of this guide walked through the waits of a page load. Before the first byte of a page arrives on a new connection, the browser has already spent one round trip opening the connection, one securing it, and one sending the request and receiving the start of the reply. Every additional domain the page uses costs the same setup again. Google’s guidance on connection hints notes that the connection setup process might involve up to three round trips, and more in unoptimised cases.
Then the files themselves. The median mobile page loads 68 requests in total: 22 JavaScript files, 12 images, 8 stylesheets and more. Many can travel side by side over one connection, but some can only be requested after another has arrived, such as a font that is named inside a stylesheet.
Even small files can cost several round trips. A new connection starts by sending a small amount of data and grows its pace with each acknowledgement, a mechanism called TCP slow start. A 2017 study of popular websites by researchers at institutions including Duke University, ETH Zürich and Akamai found that with most pages at most tens of kilobytes, bandwidth was not the problem, but slow start meant even small transfers required several round trips. Fetching just the HTML took, in the median, 37 times as long as light would need for the same round trip.
Why doesn’t faster broadband make websites load faster?
Because most of a page load is spent waiting on round trips, and extra bandwidth does not shorten them. Beyond a fairly modest speed, more megabits barely change page load time, while every millisecond cut from each round trip keeps paying off.
The classic evidence is a 2010 study by Mike Belshe, one of the engineers behind the SPDY protocol that became HTTP/2. Loading 25 popular pages under controlled conditions, he found that an increase from 5 Mbps to 10 Mbps amounted to a 5% improvement in page load times, while each 20 ms cut from the round trip yielded a 7 to 15% reduction.
Pages and protocols have changed since 2010, and the threshold has moved, but not the shape. Writing in 2023, Cloudflare noted that in more recent research the point of diminishing returns to more bandwidth has moved higher, to about 20 Mbps, but the overall trend was exactly the same. Its own data showed that for every 200 milliseconds of latency saved, page load time fell by more than a second.
Here is what that means in practice. Suppose a page needs ten round trips, one after another, before its main content appears. At 30 ms per round trip that is 300 ms of waiting. At 140 ms per round trip it is 1.4 seconds. Moving the visitor from a 100 Mbps plan to a 1 Gbps plan saves about a fifth of a second of transfer on a 2.6 MB page. Shortening the round trips saves more than a second.
How fast can a round trip be?
No faster than light in glass. Light in optical fibre travels at about 200,000 kilometres per second, roughly two-thirds of its speed in a vacuum, and distance converts directly into a minimum delay that no network upgrade can remove for any visitor.
Ilya Grigorik’s reference text High Performance Browser Networking works the numbers through. Using the rule of thumb that light in fibre travels around 200,000,000 metres per second, a round trip between New York and London, 5,585 km apart, takes at least 56 ms. Real routes are longer than straight lines and every router adds a little, so measured round trips are higher.
The visitor’s own connection adds its share before the data even reaches the wider internet. Ofcom’s 2025 mobile report found average 5G response times between 15 ms and 21 ms across the UK’s mobile networks, and 4G between 18 ms and 23 ms. Those figures are one way, half of a round trip, and measured to the test server nearest the phone. If your website is served from another continent, everything beyond that nearest server comes on top.
So where your server sits sets a floor under every round trip. A shopper near your origin pays a little for each one. A shopper an ocean away pays the floor many times over on every page.
What can a site owner do about latency?
You cannot change a visitor’s broadband or the speed of light, but you can change how many round trips your pages need and how far each one travels. Those two levers cover most of the latency a site owner controls.
Make fewer round trips.
- Use fewer domains for critical files, because every new domain pays connection setup again.
- Serve over HTTP/2 or HTTP/3, which let many files share one connection, with TLS 1.3, which secures a new connection in one round trip.
- Reference important files directly in the HTML, so the browser does not discover them late.
- Where a third-party domain is unavoidable, warn the browser early with a preconnect hint. Google’s guidance says early connections to important third-party origins can speed up load time by 100 to 500 ms.
Make each round trip shorter.
- Serve from close to your visitors. A content delivery network (CDN) is a network of servers that answer from near the visitor. The Web Almanac measured median TLS negotiation at 57 ms for CDNs against 177 ms for origin servers on desktop, more than three times faster.
- Cache what you can at the edge, including HTML for pages that are the same for everyone, so whole requests are answered nearby.
Neither lever helps with the time your server spends building a page that cannot be cached, such as a basket or a checkout. That is a different kind of latency.
Network latency vs server latency: what changes under load?
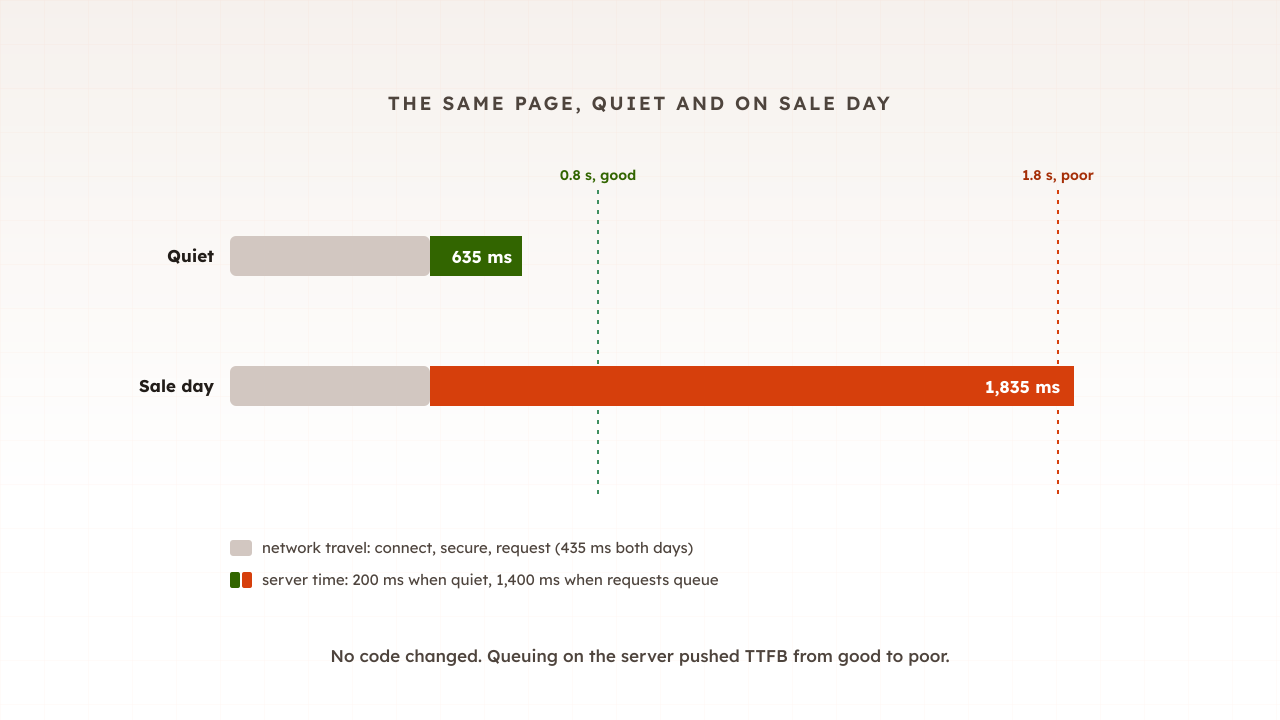
Network latency is the time spent travelling; server latency is the time spent being answered. Network latency barely changes when your site gets busy. Server latency is the one that grows, because requests start queuing for the same servers and databases.
Google’s Site Reliability Engineering book defines latency in its server sense as the time it takes to service a request, and adds that latency increases are often a leading indicator of saturation. In other words, when a server starts running out of room, its answers slow down before anything fails.
The confusion between the two meanings causes real mistakes. A team sees “latency” climb on a dashboard during a sale and blames the network, or buys a CDN for pages it cannot cache. The browser sees both kinds added together, which is why time to first byte, the subject of part 12 of this guide, mixes network travel and server thinking in one number. It is also why Core Web Vitals measured under load can differ so much from the same page measured on a quiet afternoon.
Common mistakes with latency and bandwidth
Most of these come from treating speed as one number. Each one sends effort to the wrong place.
- Judging a site from a fast office connection. Your own fibre line and nearby servers hide the round trips a mobile shopper pays.
- Buying bandwidth for a latency problem. A bigger hosting plan or a faster connection rarely helps a page that is waiting on round trips.
- Comparing latency numbers from different tools. Some report one way and some a round trip; some measure to the nearest server and some to yours. Check the method before comparing.
- Assuming a CDN fixes everything. It shortens trips for the content it can serve. Uncached pages still wait on your origin.
- Testing only when the site is quiet. Network latency looks the same at midnight and on sale day. Server latency does not.
How Evaluat measures latency under load
Every virtual user is a real browser. That means Evaluat records the same timings a customer’s browser does, broken into the phases listed on how it works: DNS lookup, connection, TLS negotiation and time to first byte, per URL and at any percentile. Tests run from the region closest to your customers, so the network part of each round trip resembles theirs.
That makes the two kinds of latency separable. If connection and TLS times hold steady while time to first byte climbs as virtual users ramp up, the network is fine and your server is queuing. You can then open a session from the slow period and watch the moment it stalled, with its network log showing which request waited.
The boundary is worth stating. A test from one region shows what this controlled browser saw under the selected test conditions, not every customer’s device and connection. For questions about field conditions across all your visitors, real-user data complements a test rather than being replaced by it.
Latency and bandwidth, then, are different limits, and web pages mostly hit the first. Count the round trips on your most important page, find out how far your server is from your customers, and measure how your server’s own latency moves when traffic arrives.
Test in real browsers. Debug in real sessions. Book a demo to see the round trips on your own pages measured under realistic load.