What counts as real-browser load testing?
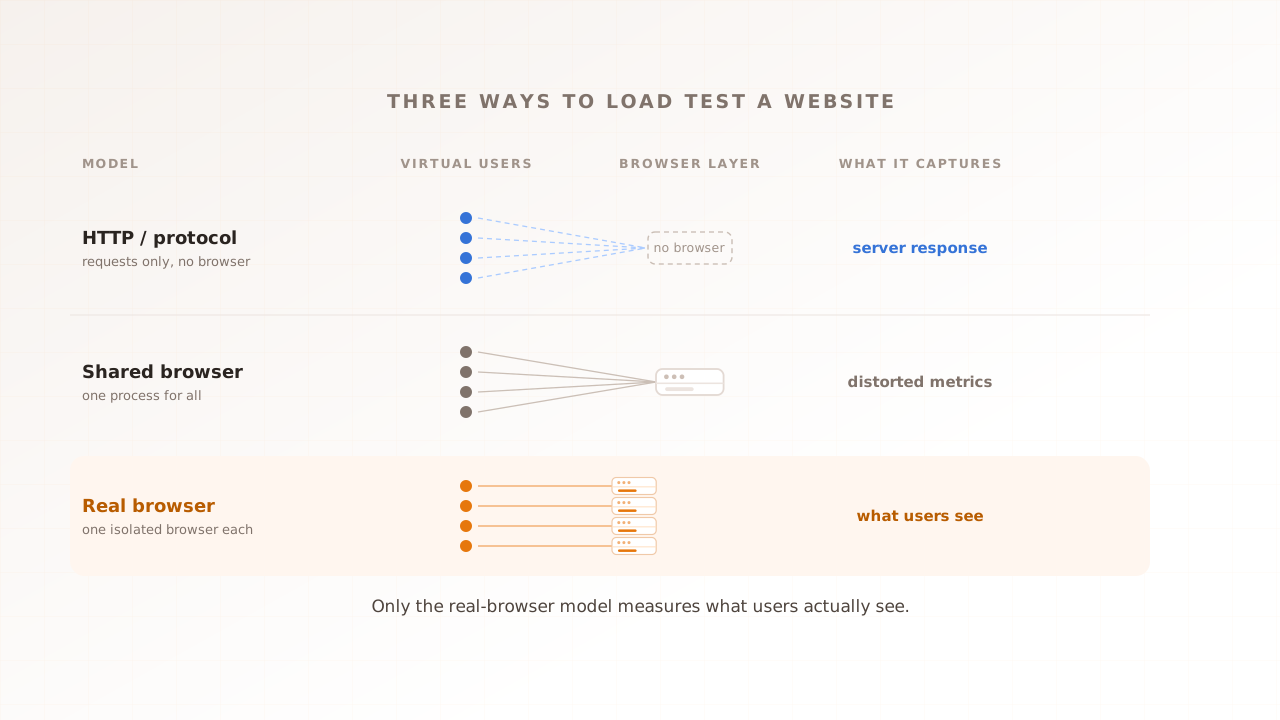
A real-browser load testing tool drives an actual browser for each virtual user to generate concurrent load, so the test measures rendering, JavaScript execution, and Core Web Vitals rather than server response time alone. The result is what those browsers saw under the selected test conditions, not a promise that every customer device or field CrUX visit will match. Recording a script in a browser does not count if the replay happens at the HTTP level, and neither does running one browser per test run.
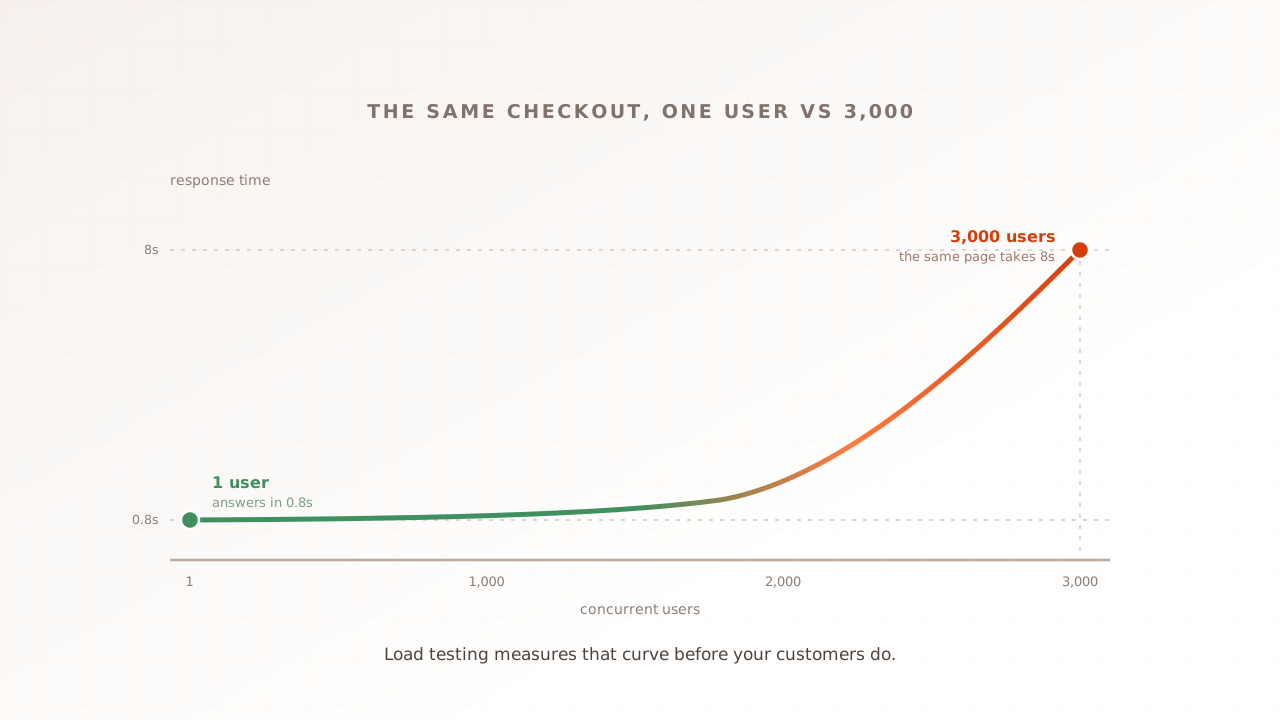
The bar matters because the two models measure different things. A protocol test proves the server answers quickly; a real-browser test proves the page works and stays usable while thousands of others are on it. If the discipline itself is new to you, what is load testing covers the foundations.
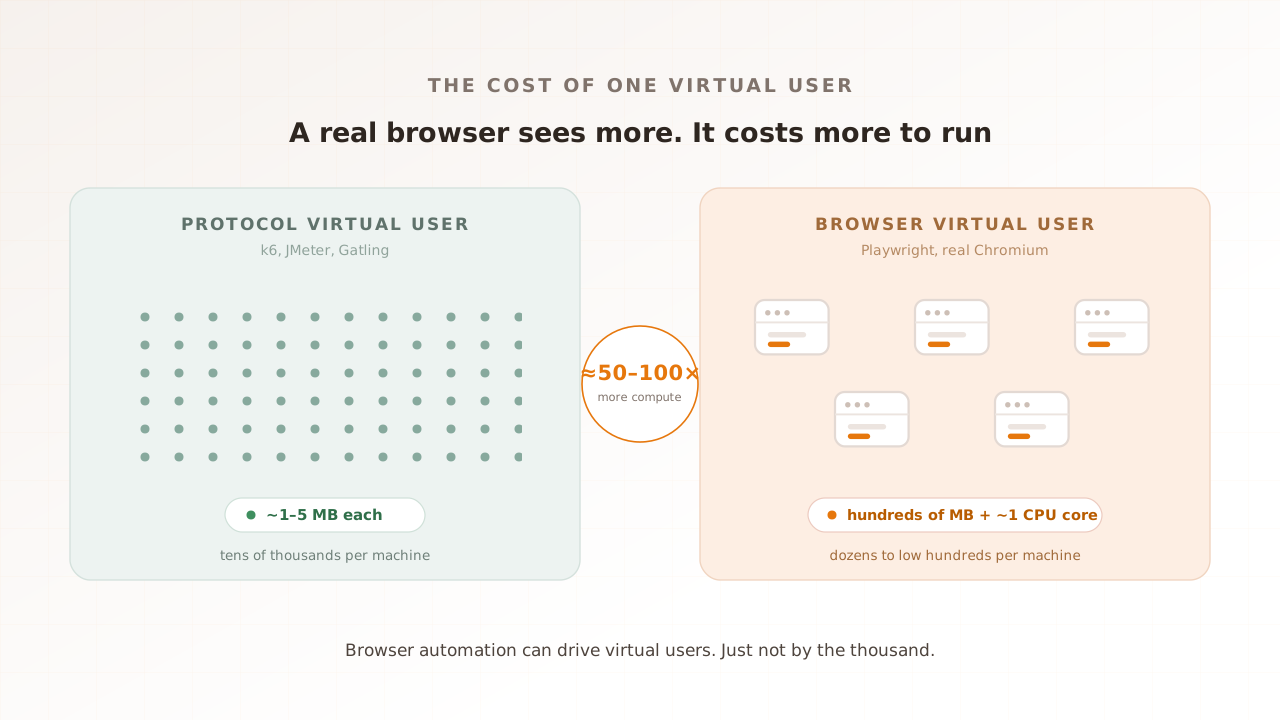
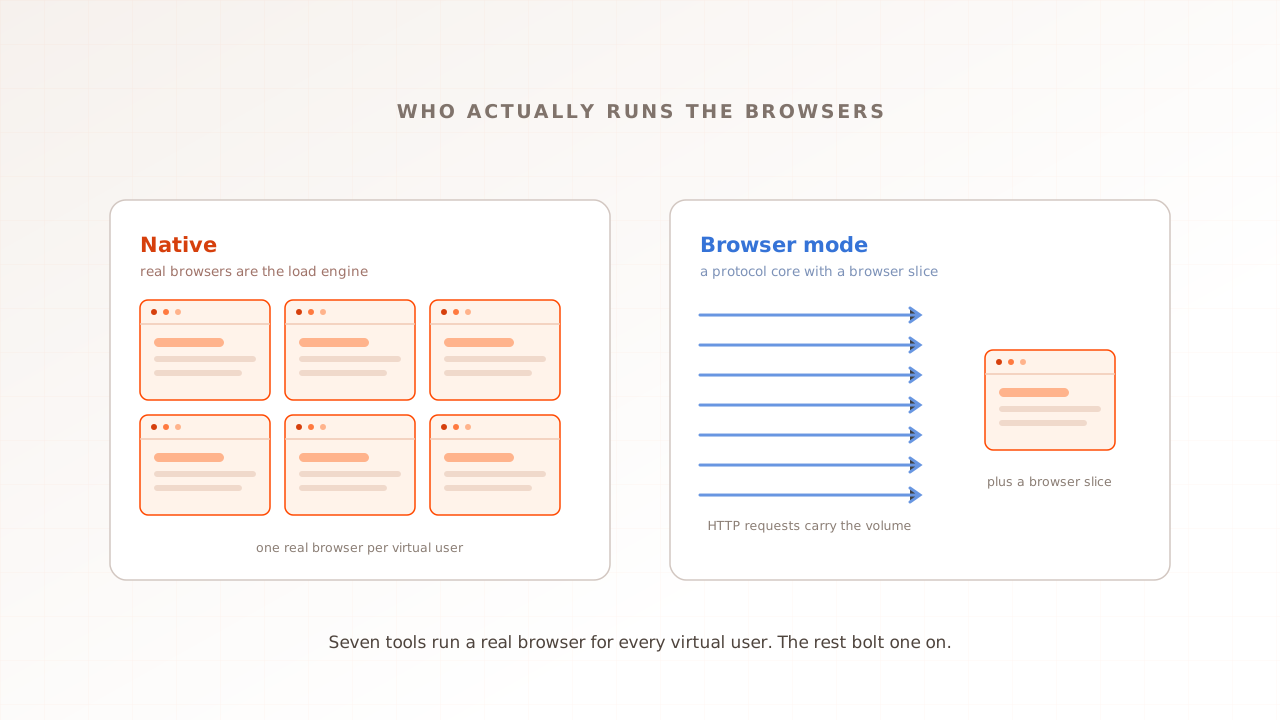
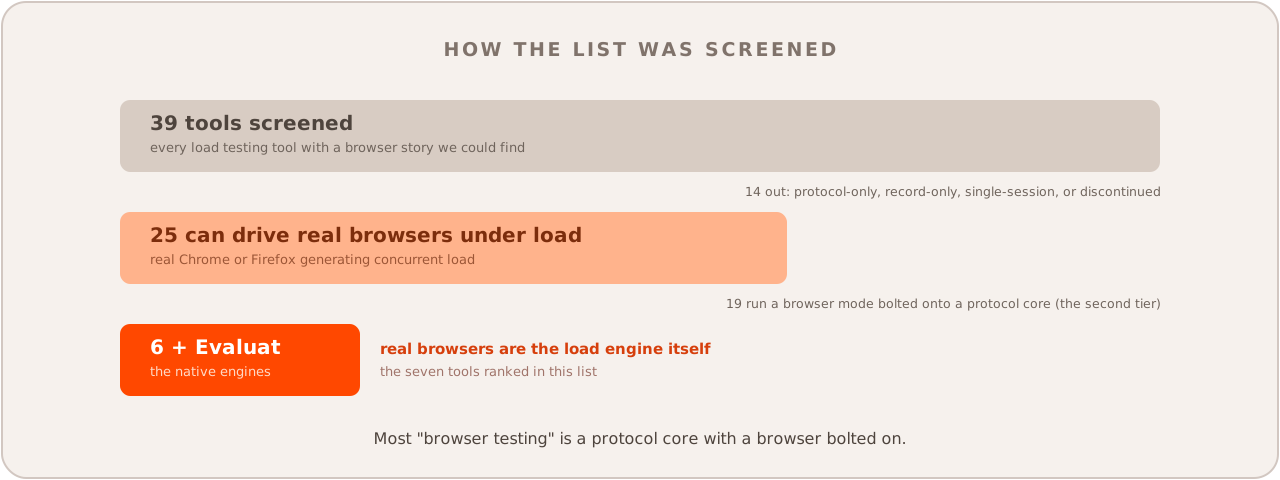
It also explains why this list is short. Browsers are expensive to run at concurrency: Dotcom-Monitor’s comparison (updated June 2026) puts a typical load injector at up to 800 HTTP sessions but only 10 to 12 headless browser sessions, and single digits with full real browsers. Artillery’s sizing guidance for its Playwright engine is one vCPU per concurrent browser user. Most vendors never pay that cost, which is why genuinely real-browser platforms are rare and why we split the field into two tiers: tools where real browsers are the load engine, and protocol tools that added a browser mode. Of the 39 third-party tools we screened for this list, 25 can genuinely drive real browsers under load, and only six use them as the native engine; Evaluat makes the seventh entry.
One disclosure before the list: Evaluat is our product. It is ranked where we believe it belongs, its limitations are listed like everyone else’s, and every third-party fact below is sourced from the vendor’s own site as of July 2026. Order reflects use-case fit, not scores.
The seven best real-browser load testing tools
1. Evaluat
Evaluat is a real-browser performance testing platform where every virtual user is a real browser, isolated from every other, with the full evidence of each session kept.
- Best for: web and e-commerce teams whose question is what customers experience under load, not just whether the server survives it.
- Standout: depth of per-user capture. The three Core Web Vitals (LCP, INP, and CLS), plus FCP and TTFB, percentile views, a per-report Apdex score, and session video, network logs, and console logs for each user. When a checkout fails at peak, you open that session and watch the moment it broke. Scenarios are built in a visual editor by recording a journey, with no scripting, and tests run from selected regions.
- Pricing: plan-based virtual user-minute allowances; sales-led with a demo call, no self-serve trial.
- Limitation: a real browser per user costs more compute than protocol virtual users, so pure API load, non-HTTP protocols, or extreme concurrency are a better fit for protocol tools like k6 or JMeter.
2. LoadView
LoadView, from Dotcom-Monitor, is a fully managed cloud platform that drives real Chrome and Firefox sessions scripted with its point-and-click EveryStep recorder.
- Best for: teams that want an established managed service with many geographic zones and no code.
- Standout: clearly tiered browser concurrency from dozens of locations: 100 concurrent browsers on Starter, 1,000 on Professional, 3,000 on Advanced.
- Pricing: as of July 2026, $199 to $1,499 per month by tier (lower on annual billing), plus on-demand and custom enterprise options.
- Limitation: entry pricing is steep for small teams, and complex flows can take iteration in the recorder. See our Evaluat vs LoadView comparison for the head-to-head.
3. LoadNinja
LoadNinja, from SmartBear, runs one real browser per virtual user and scripts through its InstaPlay recorder, replayable immediately after recording.
- Best for: QA teams that want scriptless browser load tests running within minutes.
- Standout: recordings replay in real browsers without protocol correlation work, with navigation-timing metrics straight from the DOM.
- Pricing: as of July 2026, hour packs: $350 for 25 testing hours at 100 virtual users, up to $1,375 at 500, with custom enterprise above that.
- Limitation: hour-pack economics get expensive for frequent or sustained testing, and unused hours expire after one year.
4. BrowserStack Load Testing
BrowserStack Load Testing reuses the Selenium, Playwright, Nightwatch, or WebdriverIO suites you already have as browser load tests, combined with protocol users for volume.
- Best for: engineering teams with existing browser automation suites who want load without rewriting them.
- Standout: script reuse plus hybrid scale: up to 100 browser users with 10,000 API users on Essentials, and 1,000 browser users with a million API users on Pro.
- Pricing: contact sales; tier capabilities are public but dollar prices are not, as of July 2026.
- Limitation: browser concurrency caps at 1,000, dollar pricing is not published, and the load product is newer than the incumbents on this list.
5. BrowserUp
BrowserUp runs your existing Playwright, Selenium, or Capybara code unchanged, with a real browser per virtual user and Core Web Vitals collected automatically.
- Best for: developer-led teams who treat load tests as code and want their functional scripts to double as load scripts.
- Standout: genuine script portability, plus WebSocket support and the option to run inside your own AWS account.
- Pricing: as of July 2026, $199 per month for 100 concurrent users, $499 for 1,000, $1,499 for 3,000; enterprise custom.
- Limitation: no free tier, per-concurrency cost climbs quickly, and it is a smaller vendor with a smaller community.
6. Loadero
Loadero runs real Chrome and Firefox sessions from Selenium-based test code in Java, JavaScript, or Python, with a specialty in WebRTC and video workloads.
- Best for: teams load testing calls, conferencing, and streaming, where fake media streams and per-participant metrics matter.
- Standout: WebRTC-specific instrumentation: injectable media, per-participant logs, and WebRTC statistics dumps.
- Pricing: as of July 2026, pay-as-you-go from $250 per month and a $399 per month subscription with 10,000 compute units; 14-day trial included.
- Limitation: there is no recorder, so every test is code, and billing is metered in compute units, which takes estimation work for general web tests. See Evaluat vs Loadero for the comparison.
7. AppLoader
AppLoader, from Automai, drives the real GUI of any application through image recognition, so the “browser” can be Chrome, Citrix, a virtual desktop, or a legacy client.
- Best for: organizations load testing beyond the web: Citrix, virtual desktops, and thick clients alongside browser apps.
- Standout: protocol independence. If a human can click it on a screen, AppLoader can load test it, no code required.
- Pricing: usage-based with custom quotes and a free trial, as of July 2026.
- Limitation: it needs real machines or VMs to render every session, image recognition is sensitive to UI changes, and costs run high at scale. Our Evaluat vs AppLoader page covers the differences.
Protocol tools that added a real-browser mode
A second tier of tools runs most load at the protocol level and can spin up real browsers for a slice of users. That hybrid is legitimate and often economical: the protocol users supply the volume while a small browser cohort measures the front end. The trade-off is that browser users are capped, billed at a premium, or both, and per-session evidence is usually thinner than in the native tools above.
| Tool | Core engine | Real-browser mode | The catch (as of July 2026) |
|---|---|---|---|
| Grafana k6 | Go, HTTP | Browser module drives real Chromium alongside protocol VUs | Resource-heavy per browser VU; cloud from $0.15 per VU-hour after 500 free monthly VU-hours |
| Loadster | Protocol bots | Playwright browser bots | Browser bots burn 4x the fuel of protocol bots on the same run |
| Tricentis NeoLoad | Protocol suite | RealBrowser user paths spin a Playwright browser per user | Enterprise product; pricing is quote-based |
| Artillery | Node, multi-protocol | First-party Playwright engine, Chromium only | Code-first with no GUI; plan one vCPU per browser user |
| BlazeMeter | JMeter/Gatling runner | Browser tests via embedded Selenium and Playwright | Free tier capped at 50 users; paid from $149 per month, metered by volume |
| OpenText LoadRunner | Enterprise protocol suite | TruClient runs a real browser per user | A full browser per user constrains generator capacity; enterprise licensing |
| JMeter + WebDriver, Locust + plugins | OSS protocol frameworks | Community real-browser executors | Free, but one browser per thread, low ceilings, and you run all the infrastructure |
One famous name is deliberately absent. Gatling loads at the protocol level only; its own blog, as of November 2025, states plainly that “browser execution is out of scope” and recommends pairing it with front-end tooling. That makes Gatling a fine HTTP load testing tool and not a real-browser one, which is exactly the distinction this list exists to draw.
Quick comparison
| Tool | Best for | Authoring | Browser users | Pricing (as of July 2026) |
|---|---|---|---|---|
| Evaluat | Customer experience under load, per-session evidence | No-code visual recorder | Every user is a real browser | VU-minute plans, sales-led |
| LoadView | Managed no-code testing, many regions | Point-and-click recorder | 100 to 3,000 by tier | $199 to $1,499/mo |
| LoadNinja | Fast scriptless starts | InstaPlay recorder | 100 to 500+ | $350 to $1,375 per 25-hour pack |
| BrowserStack | Reusing existing automation suites | Your Selenium/Playwright code | Up to 1,000 (+1M API users) | Contact sales |
| BrowserUp | Load tests as code | Your Playwright/Selenium code | 100 to 3,000 by tier | $199 to $1,499/mo |
| Loadero | WebRTC, video, and calls | Selenium code (Java/JS/Python) | Up to thousands, unit-billed | From $250/mo |
| AppLoader | Citrix, desktops, and GUIs | Image-recognition recorder | Depends on provisioned machines | Usage-based, custom |
Which tool should you pick?
- You want to know what customers see at peak, with the evidence to debug it: Evaluat. Web Vitals captured at load. Per session. Per URL. For storefronts, its Magento performance testing rehearsal is the worked example.
- You want an established managed service and broad geography: LoadView.
- You want a browser test running this afternoon with zero code: LoadNinja.
- You already maintain Playwright or Selenium suites: BrowserStack for hybrid scale, BrowserUp for portability and AWS self-hosting.
- Your product is calls or streaming: Loadero.
- Your “app” is Citrix or a desktop: AppLoader.
- Your load is mostly APIs with a front-end slice: a hybrid protocol tool. k6 is the strongest of that group, and pairing a protocol tool with a real-browser platform covers both layers.
The economics justify the split. OctoPerf measured one Playwright virtual user consuming roughly as much as 200 JMeter virtual users in its June 2026 test. Treat that as one measured workload, not a universal ratio. Use protocol tools for server capacity and real browsers for controlled rendering and journey evidence.
Test in real browsers. Debug in real sessions. Book a demo.