How does a web page load?
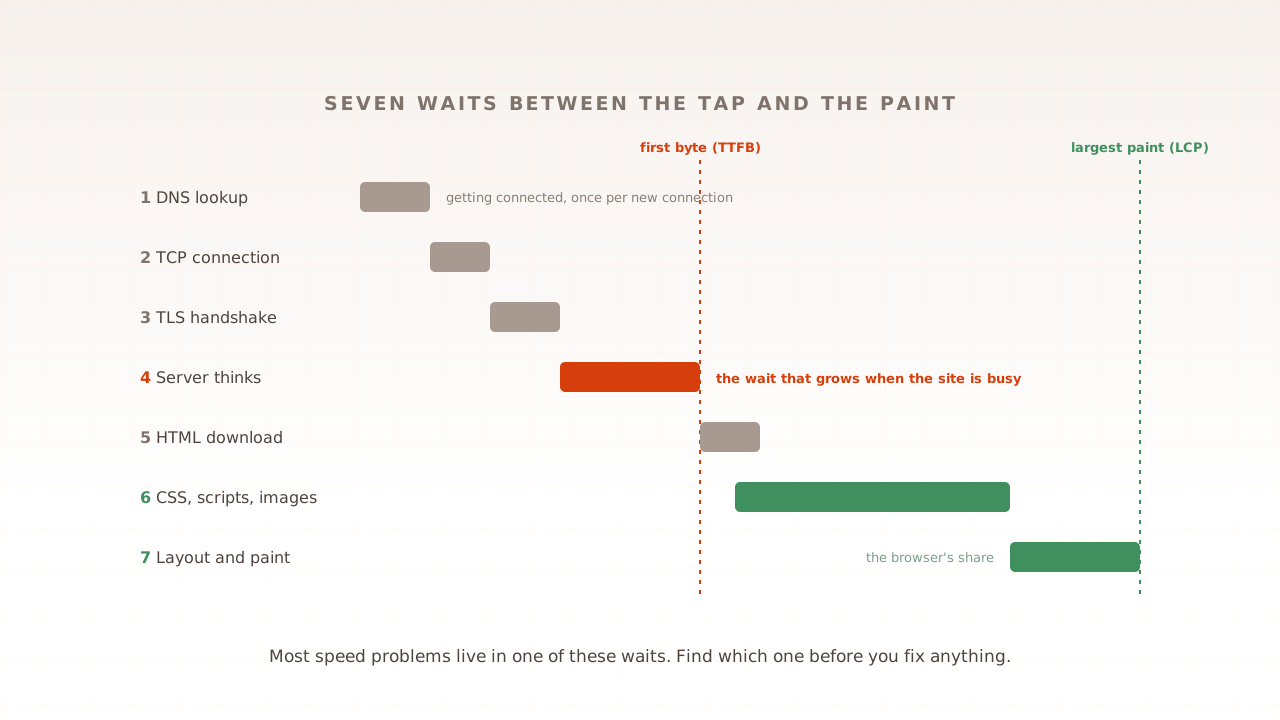
A web page loads in seven steps, and each one is a wait. The browser looks up the address, opens a connection, secures it, waits for the server to answer, downloads the HTML, fetches the files the HTML asks for, and paints the result. Each wait depends on the one before it.
If you have ever been asked what happens when you type a URL into a browser, this is the same story with the waiting times attached.
| Wait | What happens | What it costs | Grows when your site is busy? |
|---|---|---|---|
| 1. DNS lookup | The browser finds the server’s address | Nothing if cached, otherwise one lookup | No |
| 2. TCP connection | Browser and server agree to talk | One round trip | Rarely |
| 3. TLS handshake | They agree encryption keys | One round trip on modern servers | Rarely |
| 4. Server thinks | The request travels, the server builds the page, the first byte returns | One round trip plus the server’s working time | Yes, the most |
| 5. HTML download | The document arrives | One or more round trips, depending on size | A little |
| 6. Everything else | Styles, scripts, fonts and images are found and fetched | Many requests, some of which block the paint | Partly |
| 7. Render | Layout, paint and JavaScript | The speed of the visitor’s device | No |
The unit that matters through the first five waits is the round trip, the time for a message to reach the server and for the reply to come back. It belongs to the visitor’s network more than to your site. Treo’s analysis of Chrome’s real-user data for August 2026, across roughly 50,000 popular sites, puts the median round trip time at 134 milliseconds, with 145 on mobile and 92 on desktop.
That makes the arithmetic of a first visit easy to follow. On a phone, the connection takes one round trip, the security handshake one more, and the request and its reply a third. That is 435 milliseconds of pure travel before the server has done any work. Add 200 milliseconds of server time and the first byte arrives after about 635 milliseconds, with nothing yet on the screen. This is the first part of what website performance means in practice.
Wait 1: the DNS lookup
The DNS lookup turns a name such as www.example.com into the numeric address of a server. The browser asks its own cache first, then the operating system, then a resolver, usually one run by the internet provider. If any of them already knows the answer, this wait is close to zero.
An uncached lookup costs real time. Google’s public DNS documentation reports that, operating its web crawler, it has observed an average resolution time of 130 milliseconds for name servers that respond. That figure is several years old and describes uncached lookups, which are the worst case, but the order of magnitude still holds.
The detail beginners miss is that this wait is paid per hostname, not per site. MDN’s guide to how browsers work states that DNS lookups must be done for each unique hostname the requested page references. Fonts from one provider, analytics from a second and a chat widget from a third mean three more lookups. The 2025 Web Almanac found that the median page makes 83 third-party requests on desktop and 79 on mobile, and that at least 90 percent of pages use one or more third parties.
Waits 2 and 3: the TCP connection and the TLS handshake
Before any content moves, the browser and the server must open a connection and then secure it. Opening it takes one round trip. Securing it takes one more with TLS 1.3, the current version of the encryption protocol behind HTTPS, and two with the older TLS 1.2. Nothing useful has been requested yet.
The connection comes first. Ilya Grigorik’s High Performance Browser Networking puts the cost precisely, each new connection will have a full roundtrip of latency before any application data can be transferred. The same chapter calls connection reuse a critical optimisation for that reason.
Then comes the handshake. Cloudflare’s Nick Sullivan, writing when TLS 1.3 was finalised, explained that the TLS 1.2 handshake requires two additional round-trips between the browser and the server before encrypted data can be sent, and that TLS 1.3 lets encrypted data flow one round trip earlier. The newest protocol, HTTP/3, goes further. It runs over QUIC, which relies on a combined cryptographic and transport handshake to minimize connection establishment latency.
| Connection type | Round trips before the request can be sent |
|---|---|
| TCP with TLS 1.2 | 3 |
| TCP with TLS 1.3 | 2 |
| HTTP/3 over QUIC | 1 |
| A connection that is already open | 0 |
The last row is the one that matters most. These waits are paid once per connection, not once per request. HTTP/2 and HTTP/3 send many requests over a single connection, so after the first file, the rest of the files from the same host skip waits 1 to 3 entirely. Adoption is wide. Cloudflare reports that in 2025, 50 percent of requests to its network used HTTP/2, 29 percent used HTTP/1.x, and 21 percent used HTTP/3.
Distance matters too. The 2025 Web Almanac measured a median TLS negotiation time of 57 milliseconds for content delivery networks against 177 milliseconds for origin servers, more than three times faster. A content delivery network, or CDN, is a set of servers placed close to visitors, and a shorter distance means a shorter round trip.
Wait 4: the server thinks, and the first byte arrives
Once the connection is ready, the browser sends its request and waits. The server runs code, queries a database, assembles the page and starts sending it. The arrival of the first byte of that response is a named milestone, time to first byte, usually shortened to TTFB.
Google’s guidance is that good TTFB values are 0.8 seconds or less, and poor values are greater than 1.8 seconds. The same page is careful about what the number contains. As the browser measures it, TTFB is the sum of redirect time, service worker startup where one exists, the DNS lookup, connection and TLS negotiation, and the request up to the first byte. So TTFB covers waits 1 to 4 together. It is a diagnostic metric and not one of the Core Web Vitals, which are Largest Contentful Paint, Interaction to Next Paint and Cumulative Layout Shift.
There is a second TTFB, and mixing the two causes confusion. The network panel in Chrome’s developer tools shows a bar called Waiting, which it defines as one round trip of latency and the time the server took to prepare the response. That version excludes the connection setup. When someone quotes a TTFB, ask which one.
This wait decides a great deal. A Chrome team analysis of real-user data found that for at least half of the sites with poor Largest Contentful Paint, a 75th percentile TTFB of 2,270 milliseconds alone nearly guarantees that the page cannot reach the 2.5 second good threshold. A CDN often cannot help, because the Web Almanac found that only 35 percent of HTML is served through one. The page itself usually comes from your own servers.
Wait 5: the HTML downloads
The HTML document arrives in pieces, and the first piece is small. A new connection starts cautiously and speeds up as it proves reliable, a behaviour called slow start. The standard that set today’s starting size raised TCP’s initial window to 10 segments, a maximum of 14,600 bytes. That is the origin of the advice that the first 14 kilobytes matter.
In practice, a compressed HTML document under about 14 kilobytes can arrive in a single round trip. A larger one needs a second or a third. The browser does not wait for the whole document, though. It begins reading the HTML as the bytes arrive, which is why the order of things in your HTML affects how soon the next wait can begin.
Wait 6: the browser finds and fetches everything else
As the HTML streams in, the browser discovers everything else the page needs, which is stylesheets, scripts, fonts and images, and it requests them. How early it discovers each file, and whether the file blocks the paint, usually matters more than how large the file is.
Two mechanisms are at work. The main parser builds the page structure and stops whenever it meets an ordinary script. Alongside it runs a preload scanner, which Google’s web.dev describes as examining the raw markup to find resources to opportunistically fetch before the primary HTML parser would otherwise discover them. The scanner only reads HTML. It cannot see an image set as a CSS background, a script injected by another script, or content that JavaScript builds in the browser.
Some files also hold up the paint. Google’s performance course explains that some resources are deemed so critical that the browser pauses page rendering until it has dealt with them, and CSS falls into this category by default. Ordinary scripts in the head of the page block the parser, which has the same effect.
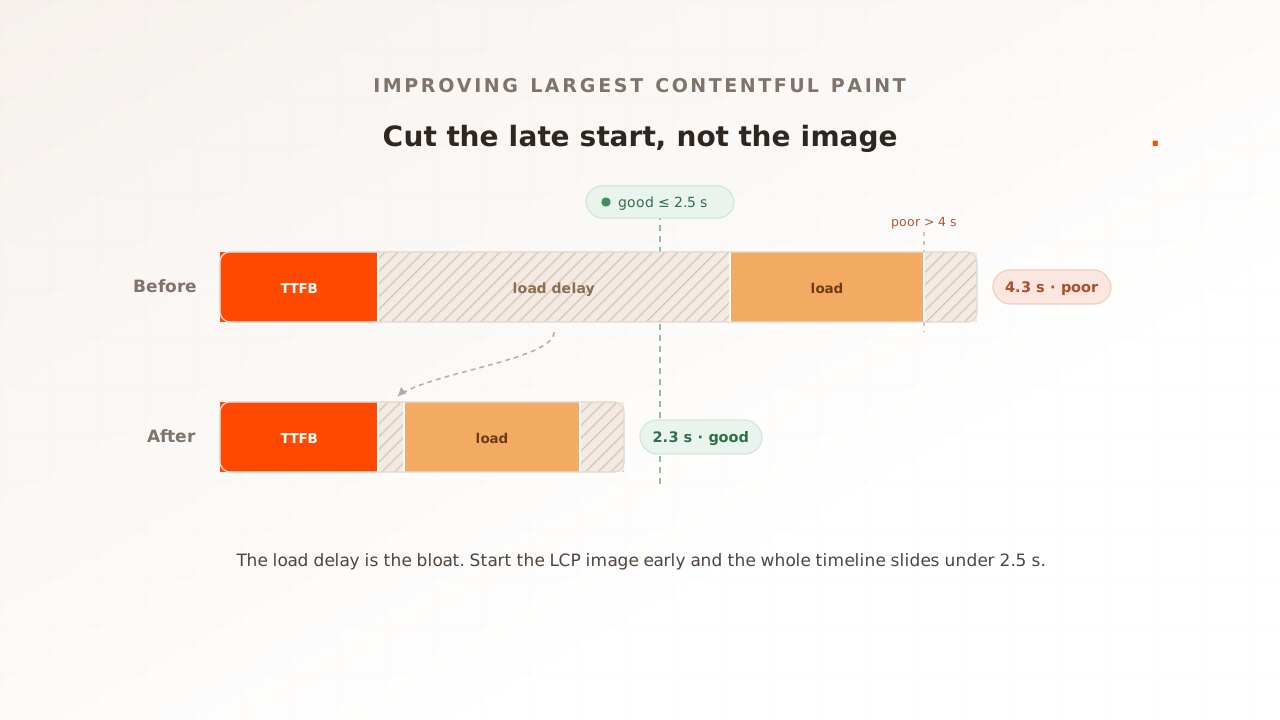
The Chrome team’s data shows how much time hides here. On sites with poor Largest Contentful Paint, the median page waits 1.3 seconds between the first byte and starting to download its main image, almost four times as long as the download itself takes. The image was not too big. The browser simply found out about it late.
Wait 7: layout, paint and JavaScript
With the structure, the styles and the key files in hand, the browser calculates where everything goes, paints the pixels, and runs the page’s JavaScript. This wait belongs to the visitor’s device. A recent laptop clears it in a moment, and a budget phone can take several times longer on the same page.
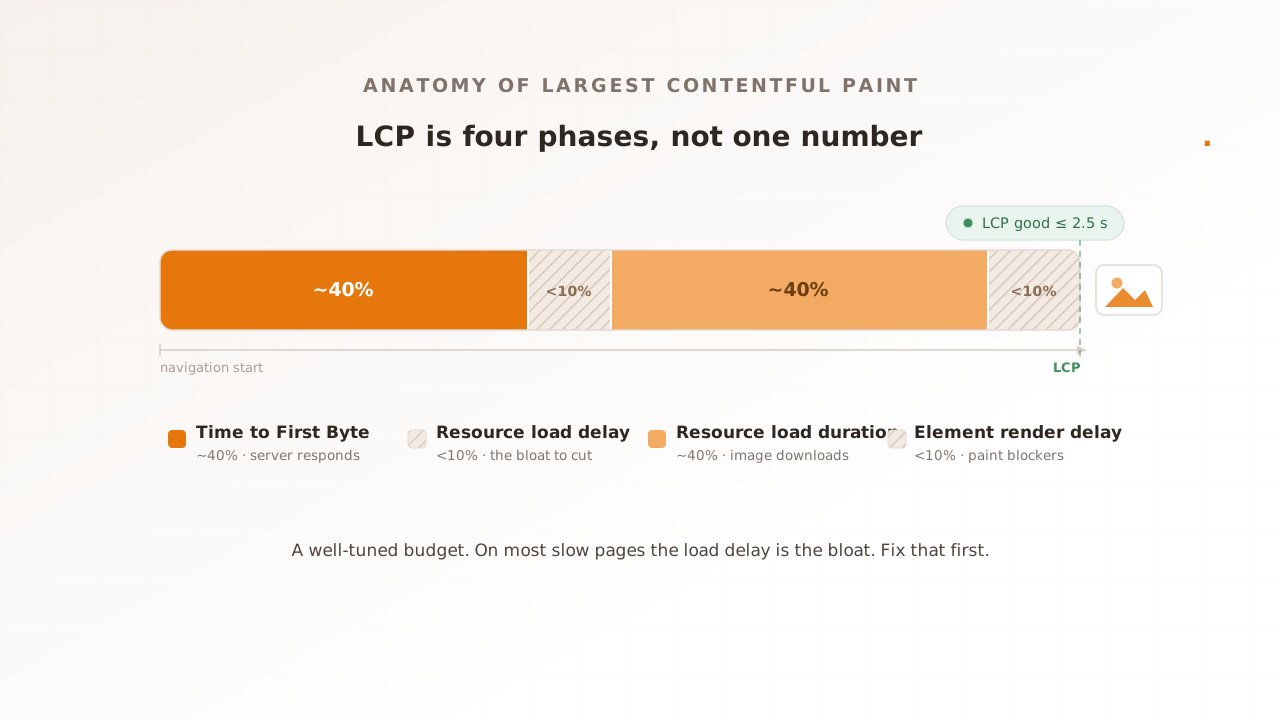
Three milestones describe what the visitor sees. First Contentful Paint is the first moment any content appears. Largest Contentful Paint, or LCP, is the moment the main content appears, and Google’s target is 2.5 seconds or less for at least 75 percent of page visits. Our guide to Largest Contentful Paint covers it in depth, and how to improve LCP covers the fixes. After that, heavy JavaScript can keep the page from responding to taps even though it looks finished.
Two older events are often mistaken for these. MDN explains that DOMContentLoaded fires when the HTML has been parsed and deferred scripts have run, and that it doesn’t wait for other things like images, subframes, and async scripts to finish loading. The load event fires when everything has finished. Neither one tells you when a person could see the page.
Which wait is slowing your site down?
Find the slow wait by measuring each one, because the fixes have almost nothing in common. A faster server does nothing for a late-discovered image, and compressing images does nothing for a slow database. Browsers record the timestamps for you through the Navigation Timing interface.
Paste this into the browser console on any page.
const nav = performance.getEntriesByType('navigation')[0];
console.table({
    dnsLookup: nav.domainLookupEnd - nav.domainLookupStart,
    connection: nav.connectEnd - nav.connectStart, // includes the TLS handshake
    tlsHandshake: nav.secureConnectionStart ? nav.requestStart - nav.secureConnectionStart : 0,
    serverWait: nav.responseStart - nav.requestStart,
    htmlDownload: nav.responseEnd - nav.responseStart,
    domContentLoaded: nav.domContentLoadedEventEnd,
    load: nav.loadEventEnd,
});
The formulas follow MDN’s list of typical resource timing metrics. Values are in milliseconds. A zero for the first three means the address was cached or the connection was already open, which is how a repeat visit looks.
| What you see | The likely wait | First thing to try |
|---|---|---|
| Slow first visit, quick repeat visits | 1 to 3, getting connected | A CDN, fewer third-party hostnames, preconnect hints for the essential ones |
| A long server wait on every page | 4, the server | Page caching, slow database queries, server capacity |
| Quick first byte, late main content | 6, discovery | Put the main image in the HTML, preload it, defer scripts that block |
| Content appears, then the page freezes | 7, the device | Less JavaScript, smaller tasks |
| Fast for you, slow for customers during busy hours | 4, under load | Measure the page while the site is busy |
For a quick look at one page, our free website speed test loads it once in a real browser and reports LCP and CLS, plus FCP and TTFB, with a video of the load.
Which waits get worse when the site is busy?
Mostly one of them. When many people arrive at once, the server’s thinking time, wait 4, is the one that stretches, because requests start to queue for the same workers, database connections and downstream services. The waits before it and the rendering after it depend on each visitor’s own network and device, so your traffic barely touches them.
We should be clear about the status of that statement. We have not found a published study that separates the seven waits under load, so the table at the top of this article reflects our own engineering judgement, informed by what load tests show. The principle underneath it is well established. Google’s Site Reliability Engineering book notes that latency increases are often a leading indicator of saturation. A rising server wait is usually the first visible sign that a system is running out of room.
The “rarely” and “partly” entries deserve a sentence each. Connection setup can slow if the machine that accepts connections is itself overwhelmed, though with a CDN or a load balancer in front that is unusual. Wait 6 is mixed. Your static files are normally served from a CDN and hold up well, but the calls a page makes to your own APIs, and to third-party services having their own busy day, can slow down with everything else.
This is why a page that scores well in a speed test on a quiet afternoon can still disappoint during a sale. The speed test measured waits 1 to 7 with wait 4 at its best. Evaluat is built to measure the same page while realistic traffic is running, with every virtual user in its own real browser, recording Core Web Vitals and Navigation Timing metrics for each one. Web Vitals captured at load. Per session. Per URL. You can see which wait moved, and open the session in which it happened. How the two kinds of measurement fit together is covered in Core Web Vitals under load.
Common mistakes when thinking about page loads
Most mistakes here come from treating a page load as one number instead of seven waits. Each of these sends effort to the wrong place.
- Reading TTFB as server time. As browsers report it, TTFB includes the DNS lookup and the connection setup. Check the server wait separately before blaming the back end.
- Shrinking images when the delay is discovery. If the main image is requested late, making it smaller saves little. Make it findable in the HTML first.
- Blaming HTTPS. With TLS 1.3 the handshake costs one round trip on a new connection and nothing afterwards.
- Using the load event as the finish line. It fires when the last file arrives, which can be long after, or occasionally before, the moment the page looked ready.
- Testing only repeat visits. Your own browser has the address cached, the connection open and the files stored. New customers have none of those.
- Testing only a quiet site. One visitor on an idle server measures wait 4 at its best, and it is the wait most likely to change.
A page load, then, is a relay of seven waits. The browser gets connected, the server thinks, the document arrives, the rest is found and fetched, and the device paints. Measure each one before you fix anything, and measure the server wait twice, once when the site is quiet and once when it is busy.
Test in real browsers. Debug in real sessions. Book a demo to see your own pages measured with realistic traffic on them.