What you need before you start
A first load test needs eight things, and most of them are decisions rather than software. Gather them first and the test itself fits into an afternoon. The example throughout this guide is one online store, and the numbers at each step are illustrative.
- Access to your analytics. The test is sized from your real traffic, so you need sessions by hour and average session duration.
- A journey you can run safely. Checkout is the journey that matters, and you need a way to run it without charging cards or shipping parcels, such as a payment sandbox or a test payment method.
- Permission, in writing. You need it from whoever owns the site, and often from the hosting provider too. Step 4 covers this.
- Somewhere to run it. Production in a quiet window, or a staging environment that mirrors production.
- Test accounts and data. Unique logins, products and search terms, so every simulated shopper is not the same shopper.
- A load testing tool. Either a protocol-level tool or a real-browser one. Step 5 explains the choice.
- A view of your servers. Whatever monitoring your host or platform provides, open while the test runs.
- An afternoon. About four hours covers the setup, a small test, the real run and a first reading of the results.
Load testing itself is covered in what is load testing. This guide is the practical companion, how to do load testing on your own site for the first time.
Step 1: Pick one journey that earns money
Choose the single path that matters most to revenue and test that. For a store it is browse, open a product, add to cart, and check out. One journey done properly beats five done badly, and it keeps the first result easy to read.
The homepage is the wrong place to start. It is usually served from a cache or a content delivery network, so it survives traffic that checkout cannot. Real failures happen deeper in the journey. When Nintendo Switch 2 preorders opened on 24 April 2025, shoppers at Target, Walmart and Best Buy reported checkout errors, address verification failures and payment glitches. Those are problems in checkout, reported at retailers with large engineering teams, on a night of exceptional demand.
Write the journey as plain steps. For the store in this guide it reads as follows. Open the homepage, open a category, open a product, add it to the cart, view the cart, start checkout as a guest, enter an address, choose delivery, and stop at the payment step. You have finished this step when the journey fits on a sticky note.
Step 2: Set a pass or fail target before you test
Write down what passing means before any traffic flows, in numbers. A workable first set is three lines. The 95th percentile of page response time stays under two seconds, checkout steps stay under three seconds, and fewer than one percent of requests fail. A test without targets produces a chart and an argument.
The 95th percentile, written p95, is the time that 95 percent of requests beat. Use it rather than the average, because averages hide the customers who are having a bad time. Google’s Site Reliability Engineering book gives the classic illustration, a service where a typical request takes about 50 milliseconds while 5% of requests are 20 times slower. The average looks healthy and one visitor in twenty waits a full second. Our guide to p95 and p99 response times goes deeper.
Microsoft’s architecture guidance frames targets the same way, set the threshold at the 95th percentile, and any run above it is a fail. It also uses a one percent cap on failed requests as its example error budget. Your own limits may differ. What matters is that they exist before the result does. This step is done when three lines are written where the team can see them.
Step 3: Size the test from real traffic
Size the test from the people on your site at the same moment, which is called concurrency, and never from daily visitors. The formula is sessions in your busiest hour, multiplied by the average session length in minutes, divided by 60. Then add headroom of 20 to 50 percent.
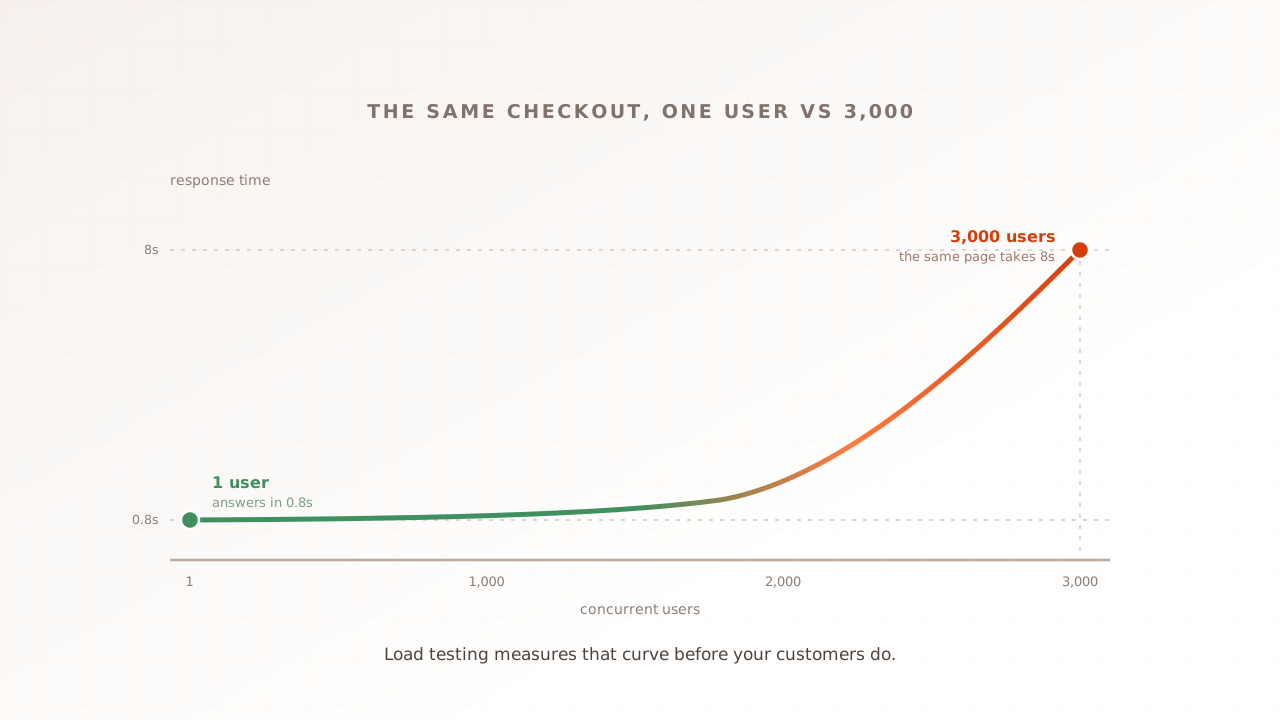
Open your analytics and find the busiest hour of the last month. The store in this guide had 3,000 sessions in that hour, averaging five minutes each. That gives 3,000 multiplied by 5, divided by 60, which is 250 people on the site at once. Adding 20 percent headroom makes the target 300 virtual users. A virtual user is one simulated visitor working through your journey.
The same arithmetic appears in the k6 documentation as hourly sessions multiplied by average session duration in seconds, divided by 3,600. It also gives the reason to use the busiest hour, because daily averages can mask significant traffic variations that occur throughout the day. Part 7 of this guide covers the calculation in full, with a worksheet. You have finished when you hold one number and can show its working.
Step 4: Choose where to test, and warn the people who need warning
Test production in a quiet window if you can do it safely, or a staging environment that mirrors production. Then tell everyone the traffic will touch, which means your team, your hosting provider and any third-party service in the journey. A surprised host can end a first test faster than any bad script.
On the environment, Microsoft’s guidance is that your test environment should mirror production as closely as practical. It also warns that production testing directly affects real customers and belongs in off-peak hours. A staging server half the size of production can only prove half a ceiling. If you test production, pick your quietest hours, agree an abort rule, and start smaller than your target.
On permission, hosting providers differ more than most people expect. These are the published positions we checked in September 2026. Read the current page before you rely on any of them.
| Provider | Published position | Source |
|---|---|---|
| Kinsta | ”Load testing in any form is prohibited, except on dedicated servers.” | Terms of service |
| WordPress VIP | Notify VIP through a support ticket before any load or stress testing | VIP documentation |
| Adobe Commerce on cloud | Enter a support ticket naming the environments, the tools and the time frame | Adobe documentation |
| Vercel | ”Load testing is only permitted on Enterprise plans.” Unannounced tests are likely to be blocked | Vercel knowledge base |
| Amazon Web Services | A network stress test policy covers load tests run from its instances, and volumetric DDoS simulations are prohibited | EC2 testing policy |
Shopify publishes no load testing policy that we could find. Its help centre lists load testing among the ordinary explanations for bot-like traffic, and stores sit behind bot protection, so speak to Shopify Support first and read our guide to testing a Shopify store.
Third parties need the same courtesy. Payment, search, reviews and address lookup services all receive your test traffic if the journey calls them. Grafana’s guide to load testing websites states the rule in one line, don’t load test servers that you don’t own. Use each provider’s sandbox, or ask first. Finally, tell whoever runs your firewall or content delivery network, because rate limiting will otherwise block the test within minutes. This step is done when you have a time window and a list of people who know about it.
Step 5: Script the journey with think time and test data
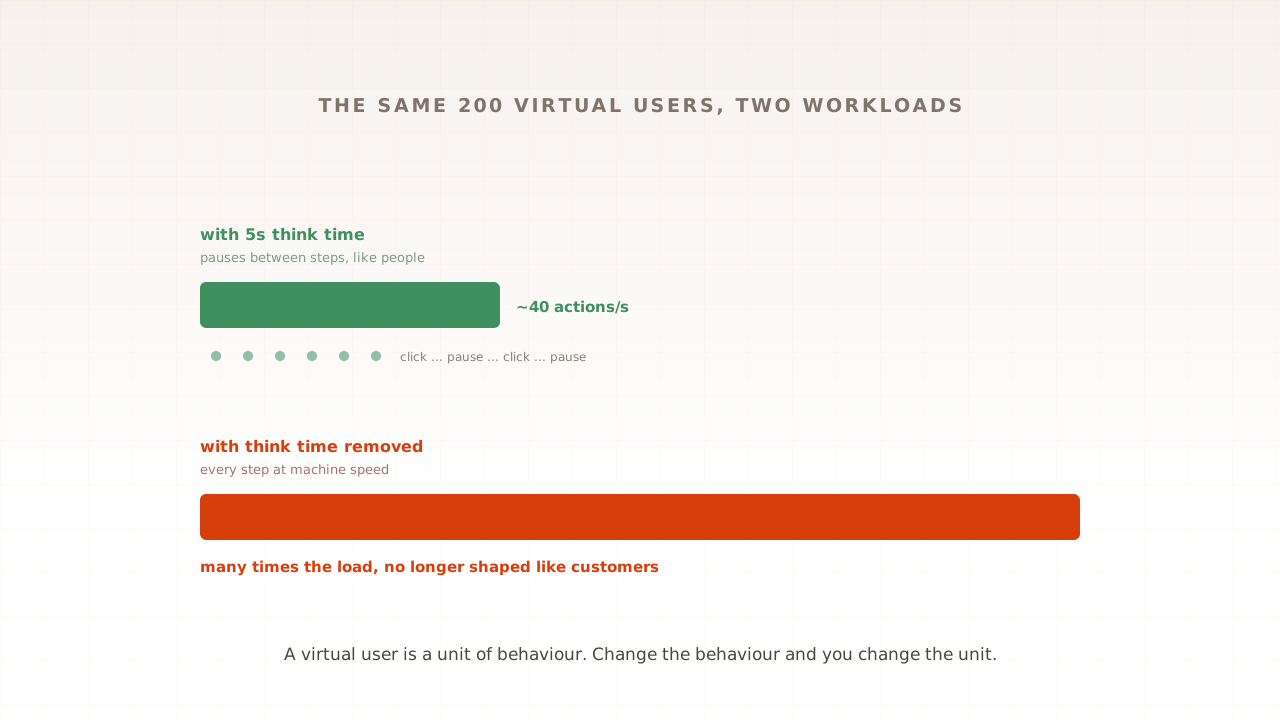
Build the journey in your tool so that each virtual user behaves like a person. That means pauses between actions, called think time, and data that differs from user to user. A script without pauses hammers the site at machine speed, and a script where everyone buys the same product mostly measures your cache.
Add a few seconds of think time after each page, more on pages where people read or type. Give each virtual user its own account or guest details, and spread them across different products and search terms. Grafana’s guide makes the point simply, real users typically don’t search for or submit the same data repeatedly.
This is also where the choice of tool matters. The same Grafana guide separates protocol-based testing, which verifies the backend by simulating the requests underlying user actions, from browser-based testing, which verifies the frontend by simulating real users in a browser.
| Protocol-level tool | Real-browser tool | |
|---|---|---|
| Examples | k6, JMeter, Gatling, Locust | Evaluat, and the browser modes some tools offer |
| What a virtual user is | A script sending HTTP requests | A real browser loading and rendering pages |
| Measures | How fast the server answers | What the visitor sees, including scripts and rendering |
| Cost per user | Low, thousands per machine | Higher, one browser per user |
| Good first choice when | The question is server or API capacity | The question is the customer’s experience at peak |
Both are legitimate. Protocol tools are free, efficient and excellent for server capacity. In that mode they do not run your JavaScript or render the page, so the result describes your servers rather than what a shopper saw, and some of them, k6 included, offer a separate browser mode for that reason. In Evaluat the journey is built once in a visual scenario editor with no scripting, datasets give every virtual user unique inputs, and popup handlers dismiss cookie banners automatically. You have finished this step when one virtual user completes the whole journey without an error.
Step 6: Smoke test with five users
Run a tiny test before the real one. Five virtual users for three to five minutes proves that the script works, the data is unique and the environment responds. It costs minutes and saves you from debugging your own test at full load.
The k6 documentation describes a smoke test as a small number of virtual users, from 2 to 20, for a short period, and adds that more than five could be considered a mini load test. Check five things while it runs. Every step of the journey passes. Each user has different data. Test orders stop before payment or go to a sandbox. No real confirmation emails or warehouse notifications are sent. Your monitoring shows the traffic arriving.
Where smoke tests fit beside full tests is covered in smoke testing vs performance testing. This step is done when five users finish with zero errors.
Step 7: Ramp up, then hold
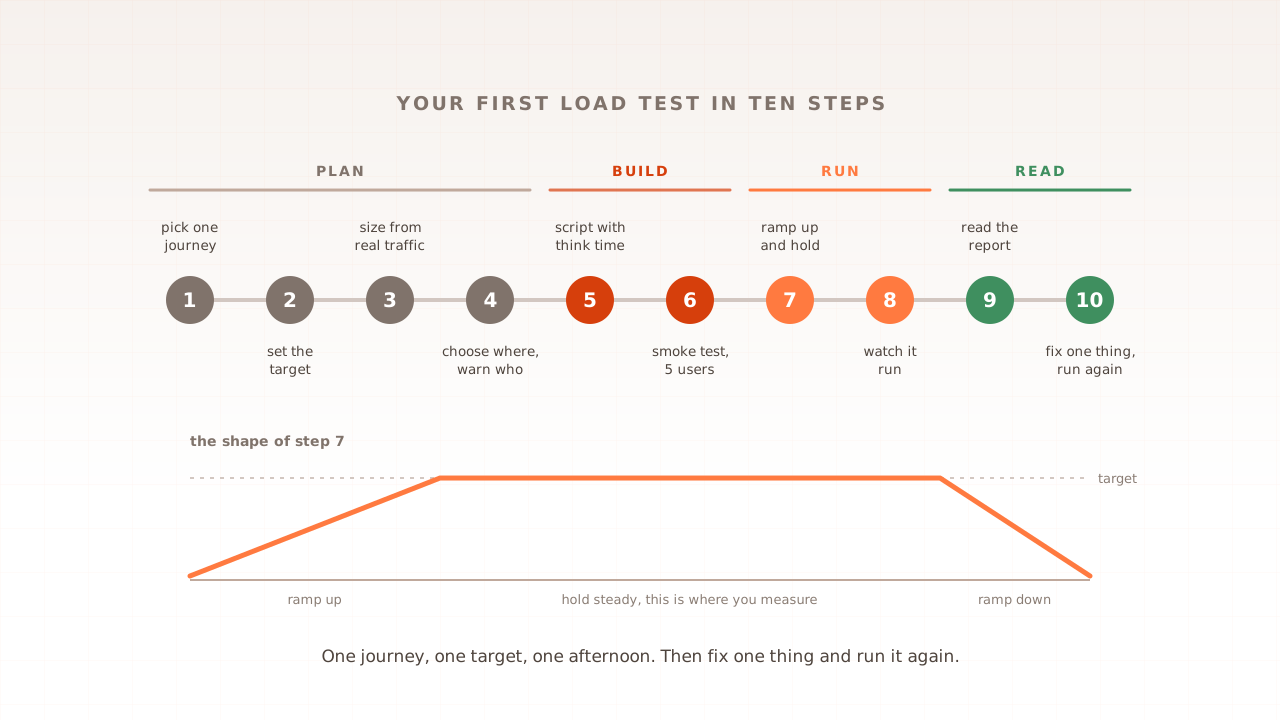
Bring the load up gradually, hold it steady at the target, then bring it down. For the store, ramp to 300 virtual users over five minutes, which is one new user each second, hold for thirty minutes, and ramp down over five. The hold is the only part you will measure.
A gradual ramp matters because real traffic builds, and because caches, connection pools and autoscaling all need time to settle. The k6 documentation offers a usable rule of thumb. The ramp-up usually lasts between 5% and 15% of the total test duration, the hold should be at least five times longer than the ramp, and its own example is five minutes up, thirty minutes held and five minutes down.
An instant jump from zero to full load is a different test, called a spike test, and it answers a different question. The types of performance testing explains each shape. You know this step worked when the active users chart climbs in a straight line to 300 and then stays flat.
Step 8: Watch the test while it runs
Stay with the test. Watch three numbers from the tool, which are response time percentiles, error rate and completed sessions per minute, next to your server dashboards. Agree an abort rule before you start, for example errors above five percent for two minutes, or any sign that real customers are affected.
Completed sessions per minute deserves its place on that list. Most tools hold a fixed number of virtual users, and each one waits for a response before its next action. When the site slows, the virtual users slow with it, and the test quietly sends less traffic than you planned. Gatling’s documentation is blunt about the mismatch between this model and a public website, saying that if you use it while your system actually behaves differently, your test is broken. For a first test the practical defence is simple. If users stay at 300 while completed sessions per minute fall, the site has reached a limit.
Check the machines generating the load as well. The k6 guidance is that CPU utilisation on the load generator stays within 80%, because a saturated generator reports response times much larger than reality. Managed platforms handle this for you. If you run your own generators, it is your job. This step ends with either a clean run or a deliberate abort with a reason written down.
Step 9: Read the report
Read the steady part of the run against the targets you wrote in step 2, and ignore the ramps. Start with errors, then p95 response time for each step of the journey, then completed sessions per minute. You are looking for the first place the journey misses a target.
Here is the store’s result at 300 virtual users.
| Journey step | p95 response | Target | Verdict |
|---|---|---|---|
| Homepage | 0.9 s | 2 s | Pass |
| Category page | 1.2 s | 2 s | Pass |
| Product page | 1.4 s | 2 s | Pass |
| Add to cart | 1.8 s | 2 s | Pass |
| Checkout, address step | 2.4 s | 3 s | Pass |
| Checkout, delivery step | 4.8 s | 3 s | Fail |
| Failed requests, all steps | 0.6% | 1% | Pass |
The test failed on one line, and that makes it a successful test. It found that the delivery step, which calls a shipping rates service, takes almost five seconds when 300 people are shopping. Nobody would have seen that on a quiet afternoon. The reading itself took ten minutes because the targets already existed.
If your tool records sessions, use them. With real-browser virtual users, a slow step comes with the visitor’s view of it, what loaded, what hung, and what the console reported. Open the session. Watch the moment it broke. The metrics in a report are explained one by one in the metrics that belong in a performance test report.
Step 10: Fix one thing and run it again
Make one change, then run the identical test. The store caches shipping rates for returning carts, re-runs the same 300 users, and the delivery step drops to 2.1 seconds. Because only one thing changed, the improvement has one explanation.
Resist the urge to fix five things at once. If the next run is better you will not know which change helped, and if it is worse you will not know which one hurt. Keep the script, the data, the target and the environment the same between runs, so the two reports can be compared line by line.
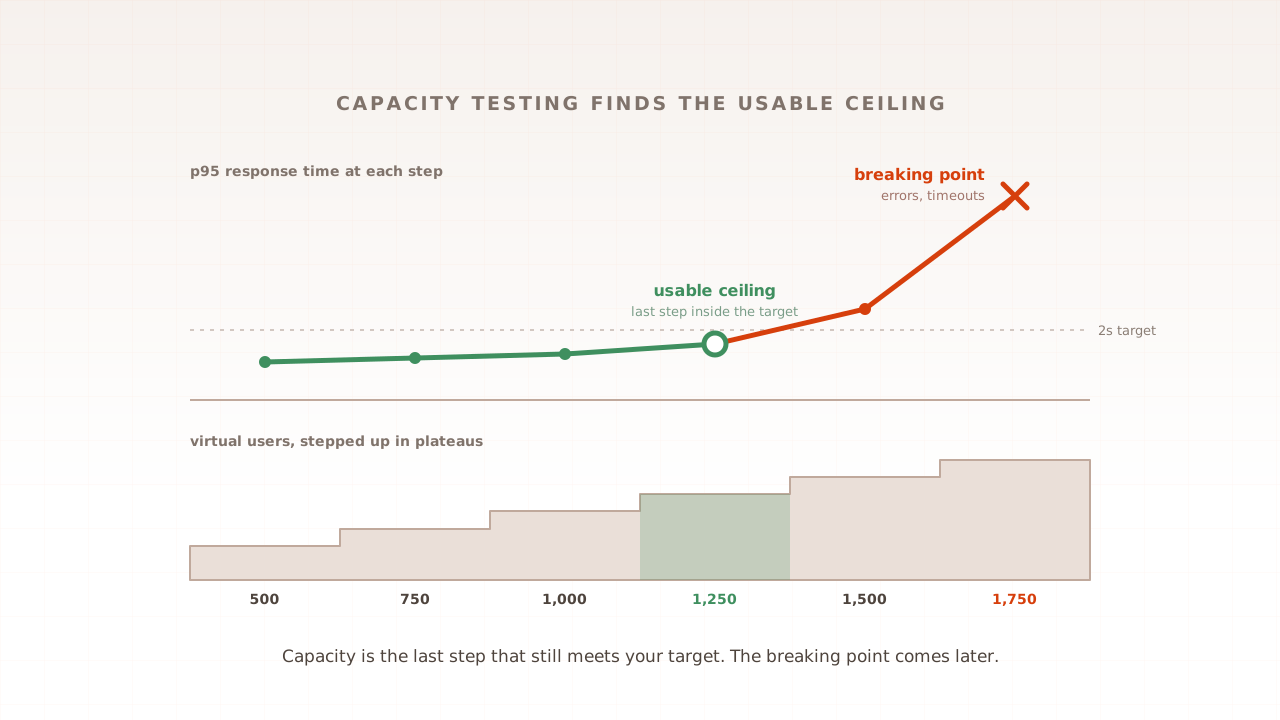
When the run passes every target, you have a baseline. The natural next question is how far above 300 the site can go before it stops passing, which is a capacity test, covered in part 5 of this guide.
How do you know the load test worked?
A load test worked if you can state its result in one sentence and defend every word. For the store that sentence is, “At 300 concurrent users, 95 percent of pages answered in under two seconds and 0.6 percent of requests failed, except the delivery step at 4.8 seconds.” Check these before you trust it.
- The active users chart reached the target and stayed flat for the whole hold.
- Completed sessions per minute stayed steady through the hold.
- The errors are your application’s errors, not blocks from a firewall or rate limiter.
- The load generators stayed within their own limits.
- Every virtual user had unique data, and the journey finished end to end.
- A second identical run gives a similar result, within about ten percent.
If one of these fails, the test has told you about your test rather than your site. Fix that and run it again before you draw conclusions.
Common problems and fixes
Most first-test problems show up in the first five minutes and have a short list of causes. Find your symptom on the left.
| Symptom | Likely cause | Fix |
|---|---|---|
| Errors from the first minute, mostly 403 or 429 | A firewall, bot protection or rate limiter is blocking the test | Tell the host and allow the test traffic for the window |
| Everything is slow from the very start | The load generators are out of CPU, or they sit far from your servers | Keep generator CPU under about 80 percent, and generate load from near your customers |
| Excellent results that nobody believes | One product, one account and a warm cache | Vary products, searches and accounts across users |
| Users stay at target while completed sessions fall | The site slowed, so the virtual users slowed with it | Treat the point where sessions flatten as the limit |
| Staging passes and production struggles | Staging is smaller or configured differently | Match production, or scale the target to the environment |
| Real customers noticed the test | Production was tested at a busy hour with no abort rule | Use a quiet window, a smaller first step and a written abort rule |
A first load test, then, is a loop rather than a project. Choose the journey, write the target, size it from your traffic, warn the right people, prove the script with five users, run, read, fix one thing, and run again. The first pass through takes an afternoon. Every pass after that takes less, because the journey, the targets and the permissions already exist.
Test in real browsers. Debug in real sessions. Book a demo and we will walk through a first test on your own journey.